Prediction comparison
Semifinal 3 Elite Men
04.08.2023
Balikesir
TUR
Race information and calculation basis
2023 Europe Triathlon Sprint and Relay Championships Balikesir
Datengrundlage: maximal zwölf Starts je Athlet:in, die zeitlich strikt vor 04.08.2023 liegen. Neuere Leistungen und direkte Duelle werden mit einer Halbwertszeit von 300 Tagen stärker gewichtet.
Prediction model used
Modell v15
Default values
Prediction quality
49/100
niedrig
Show model parameters and data quality
Not yet sufficiently calibrated – conservative defaults are used.
Einzelabstand ≤ 4 s
Gruppenspanne ≤ 14 s
Gruppeneffekt 0.65
Max. Vorteil 2.2 km/h
Datenabdeckung 58.3 % · Head-to-Head-Abdeckung 41.7 % · 0 Kalibrierungsrennen
Retrospective backtest without using the analysed race or later results.
Show methodology
Only after the historical calculation is the prediction compared with the actual result.
Prediction comparison
Summary of prediction errors
Mean place error8.3
Mean swim error18.3 s
Mean bike-speed error3.58 km/h
Correct bike groups6/24
No history0
Within the 80% range29.2 %
| Details | ||||||
|---|---|---|---|---|---|---|
| 1 / 6 |
 Jannik Schaufler
GER
|
+14 s
+8 s
|
G2 / G2
correct
|
4:47
5:13
|
16:06 | Show detailsPlacementPrediction: 1
80% range: 6–10
Top-10 probability: 90 %
Result: 6
Deviation: -5
SwimmingPrognoseabstand: +14 s
Time: 3:23
Pace: 1:15 / 100 m
Ergebnisabstand: +8 s
Fehler: 5.6 s
H2H: 2 Gegner:innen,
3 Duelle,
Korrektur 0.51 %,
Sicherheit 4 %
CyclingPrediction: Group 2 (9 people)
Gruppe 1: 43 %
Speed: 43.4 km/h
Gap ahead:
0.8 s
Gap behind:
1.8 s
Result: Group 2 (10 people)
Speed: 40.4 km/h
Tempo-Fehler: 3.04 km/h
Running and totalRun: 4:47 (2:49 / km)
Historical basis: 2:49 / km
Best comparable pace: 2:46 / km
Trend: +0:00 / km
Comparable races: 8
Fallback calculation from other run distances
H2H: 2 Gegner:innen,
3 Duelle,
Korrektur 0.08 %,
Sicherheit 4 %
Ergebnis Lauf: 5:13 (3:04 / km)
Error: −0:26 / −0:15 / km
Overall prediction: 16:06
Data basis: 12 Races · Confidence 1.00
Swimming:
3:23
(1:15 / 100 m)
To the end of cycling (group time):
11:03
(43.4 km/h)
Run:
4:47
(2:49 / km)
Total:
16:06
Target first bike group at the bike finishGoal: finish the bike split with the first bike group.
Estimated requirement:
Swim time: 3:14
Pace: 1:12 / 100 m
About 8.7 s faster in the swim
Maximum predicted gap after the swim: +4.9 s
The complete bike-group simulation, including catches and group mergers, is recalculated through the end of the bike split.
|
| 2 / 5 |
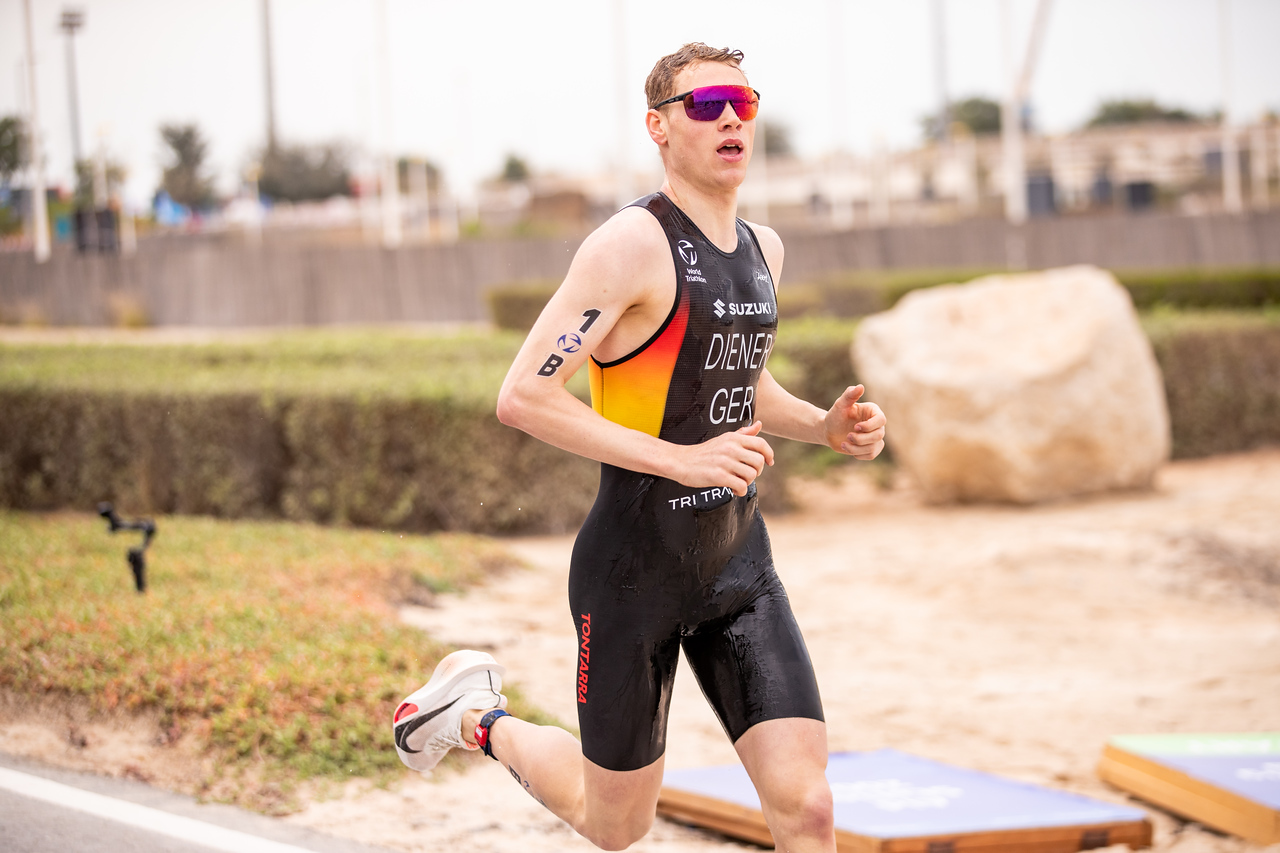 Jan Diener
GER
|
+13 s
+7 s
|
G2 / G1
|
4:54
5:24
|
16:13 | Show detailsPlacementPrediction: 2
80% range: 7–13
Top-10 probability: 74 %
Result: 5
Deviation: -3
SwimmingPrognoseabstand: +13 s
Time: 3:22
Pace: 1:15 / 100 m
Ergebnisabstand: +7 s
Fehler: 5.8 s
CyclingPrediction: Group 2 (9 people)
Gruppe 1: 49 %
Speed: 43.4 km/h
Gap ahead:
1.5 s
Gap behind:
0.8 s
Result: Group 1 (4 people)
Speed: 41.0 km/h
Tempo-Fehler: 2.46 km/h
Running and totalRun: 4:54 (2:53 / km)
Historical basis: 2:53 / km
Best comparable pace: 2:51 / km
Trend: +0:00 / km
Comparable races: 3
Fallback calculation from other run distances
Ergebnis Lauf: 5:24 (3:11 / km)
Error: −0:30 / −0:18 / km
Overall prediction: 16:13
Data basis: 12 Races · Confidence 1.00
Swimming:
3:22
(1:15 / 100 m)
To the end of cycling (group time):
11:03
(43.4 km/h)
Run:
4:54
(2:53 / km)
Total:
16:13
Target first bike group at the bike finishGoal: finish the bike split with the first bike group.
Estimated requirement:
Swim time: 3:14
Pace: 1:12 / 100 m
About 7.9 s faster in the swim
Maximum predicted gap after the swim: +4.9 s
The complete bike-group simulation, including catches and group mergers, is recalculated through the end of the bike split.
|
| 3 / 15 |
 Marcus Dey
GBR
|
+1 s
+1 s
|
G1 / G2
|
5:10
6:19
|
16:14 | Show detailsPlacementPrediction: 3
80% range: 7–13
Top-10 probability: 40 %
Result: 15
Deviation: -12
SwimmingPrognoseabstand: +1 s
Time: 3:10
Pace: 1:10 / 100 m
Ergebnisabstand: +1 s
Fehler: 0.0 s
CyclingPrediction: Group 1 (1 people)
Gruppe 1: 94 %
Speed: 43.4 km/h
Gap ahead:
–
Gap behind:
5.0 s
Result: Group 2 (10 people)
Speed: 40.1 km/h
Tempo-Fehler: 3.39 km/h
Running and totalRun: 5:10 (3:02 / km)
Historical basis: 3:02 / km
Best comparable pace: 2:57 / km
Trend: +0:00 / km
Comparable races: 3
Fallback calculation from other run distances
Ergebnis Lauf: 6:19 (3:43 / km)
Error: −1:09 / −0:41 / km
Overall prediction: 16:14
Data basis: 12 Races · Confidence 1.00
Swimming:
3:10
(1:10 / 100 m)
To the end of cycling (group time):
11:03
(43.4 km/h)
Run:
5:10
(3:02 / km)
Total:
16:14
|
| 4 / 10 |
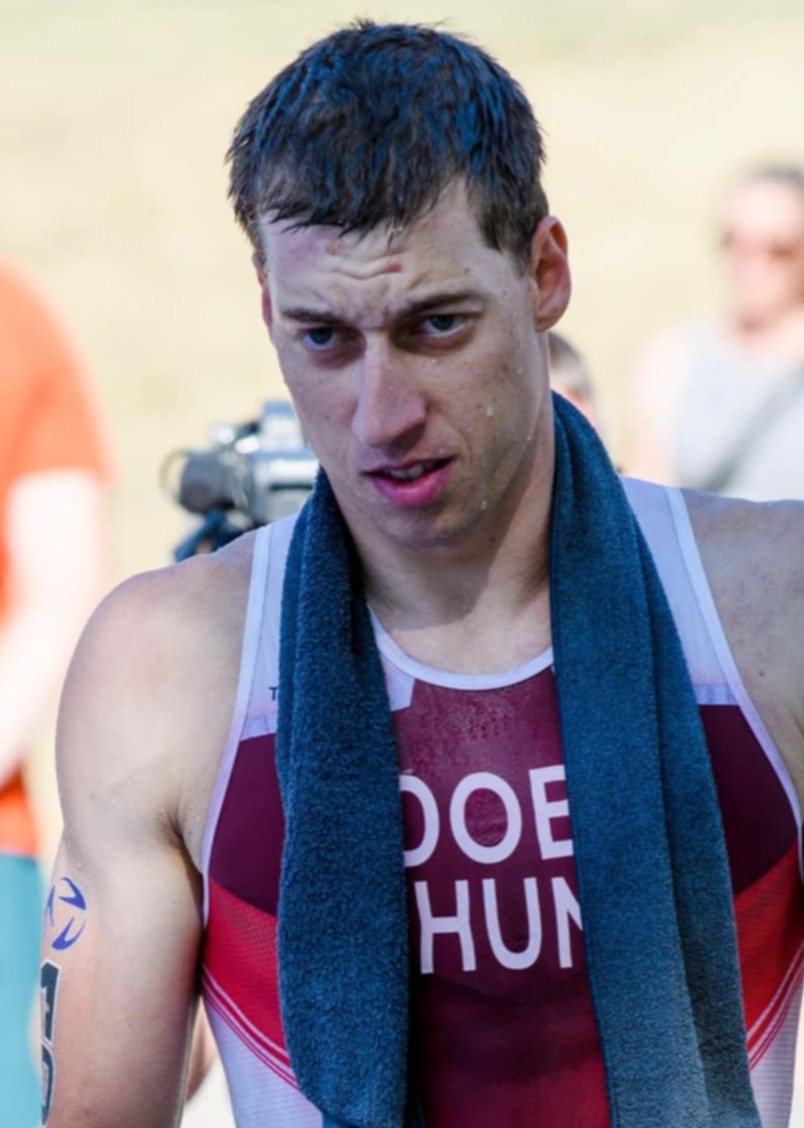 Gergő Dobi
HUN
|
+7 s
+13 s
|
G2 / G2
correct
|
4:58
5:19
|
16:17 | Show detailsPlacementPrediction: 4
80% range: 7–13
Top-10 probability: 74 %
Result: 10
Deviation: -6
SwimmingPrognoseabstand: +7 s
Time: 3:16
Pace: 1:13 / 100 m
Ergebnisabstand: +13 s
Fehler: -6.1 s
H2H: 7 Gegner:innen,
8 Duelle,
Korrektur 0.27 %,
Sicherheit 21 %
CyclingPrediction: Group 2 (9 people)
Gruppe 1: 76 %
Speed: 43.4 km/h
Gap ahead:
0.9 s
Gap behind:
0.6 s
Result: Group 2 (10 people)
Speed: 40.4 km/h
Tempo-Fehler: 3.04 km/h
Running and totalRun: 4:58 (2:56 / km)
Historical basis: 2:58 / km
Best comparable pace: 2:53 / km
Trend: −0:03 / km
Comparable races: 8
Fallback calculation from other run distances
H2H: 7 Gegner:innen,
8 Duelle,
Korrektur 0.40 %,
Sicherheit 15 %
Ergebnis Lauf: 5:19 (3:08 / km)
Error: −0:21 / −0:12 / km
Overall prediction: 16:17
Data basis: 12 Races · Confidence 1.00
Swimming:
3:16
(1:13 / 100 m)
To the end of cycling (group time):
11:03
(43.4 km/h)
Run:
4:58
(2:56 / km)
Total:
16:17
Target first bike group at the bike finishGoal: finish the bike split with the first bike group.
Estimated requirement:
Swim time: 3:14
Pace: 1:12 / 100 m
About 2 s faster in the swim
Maximum predicted gap after the swim: +4.9 s
The complete bike-group simulation, including catches and group mergers, is recalculated through the end of the bike split.
|
| 5 / 1 |
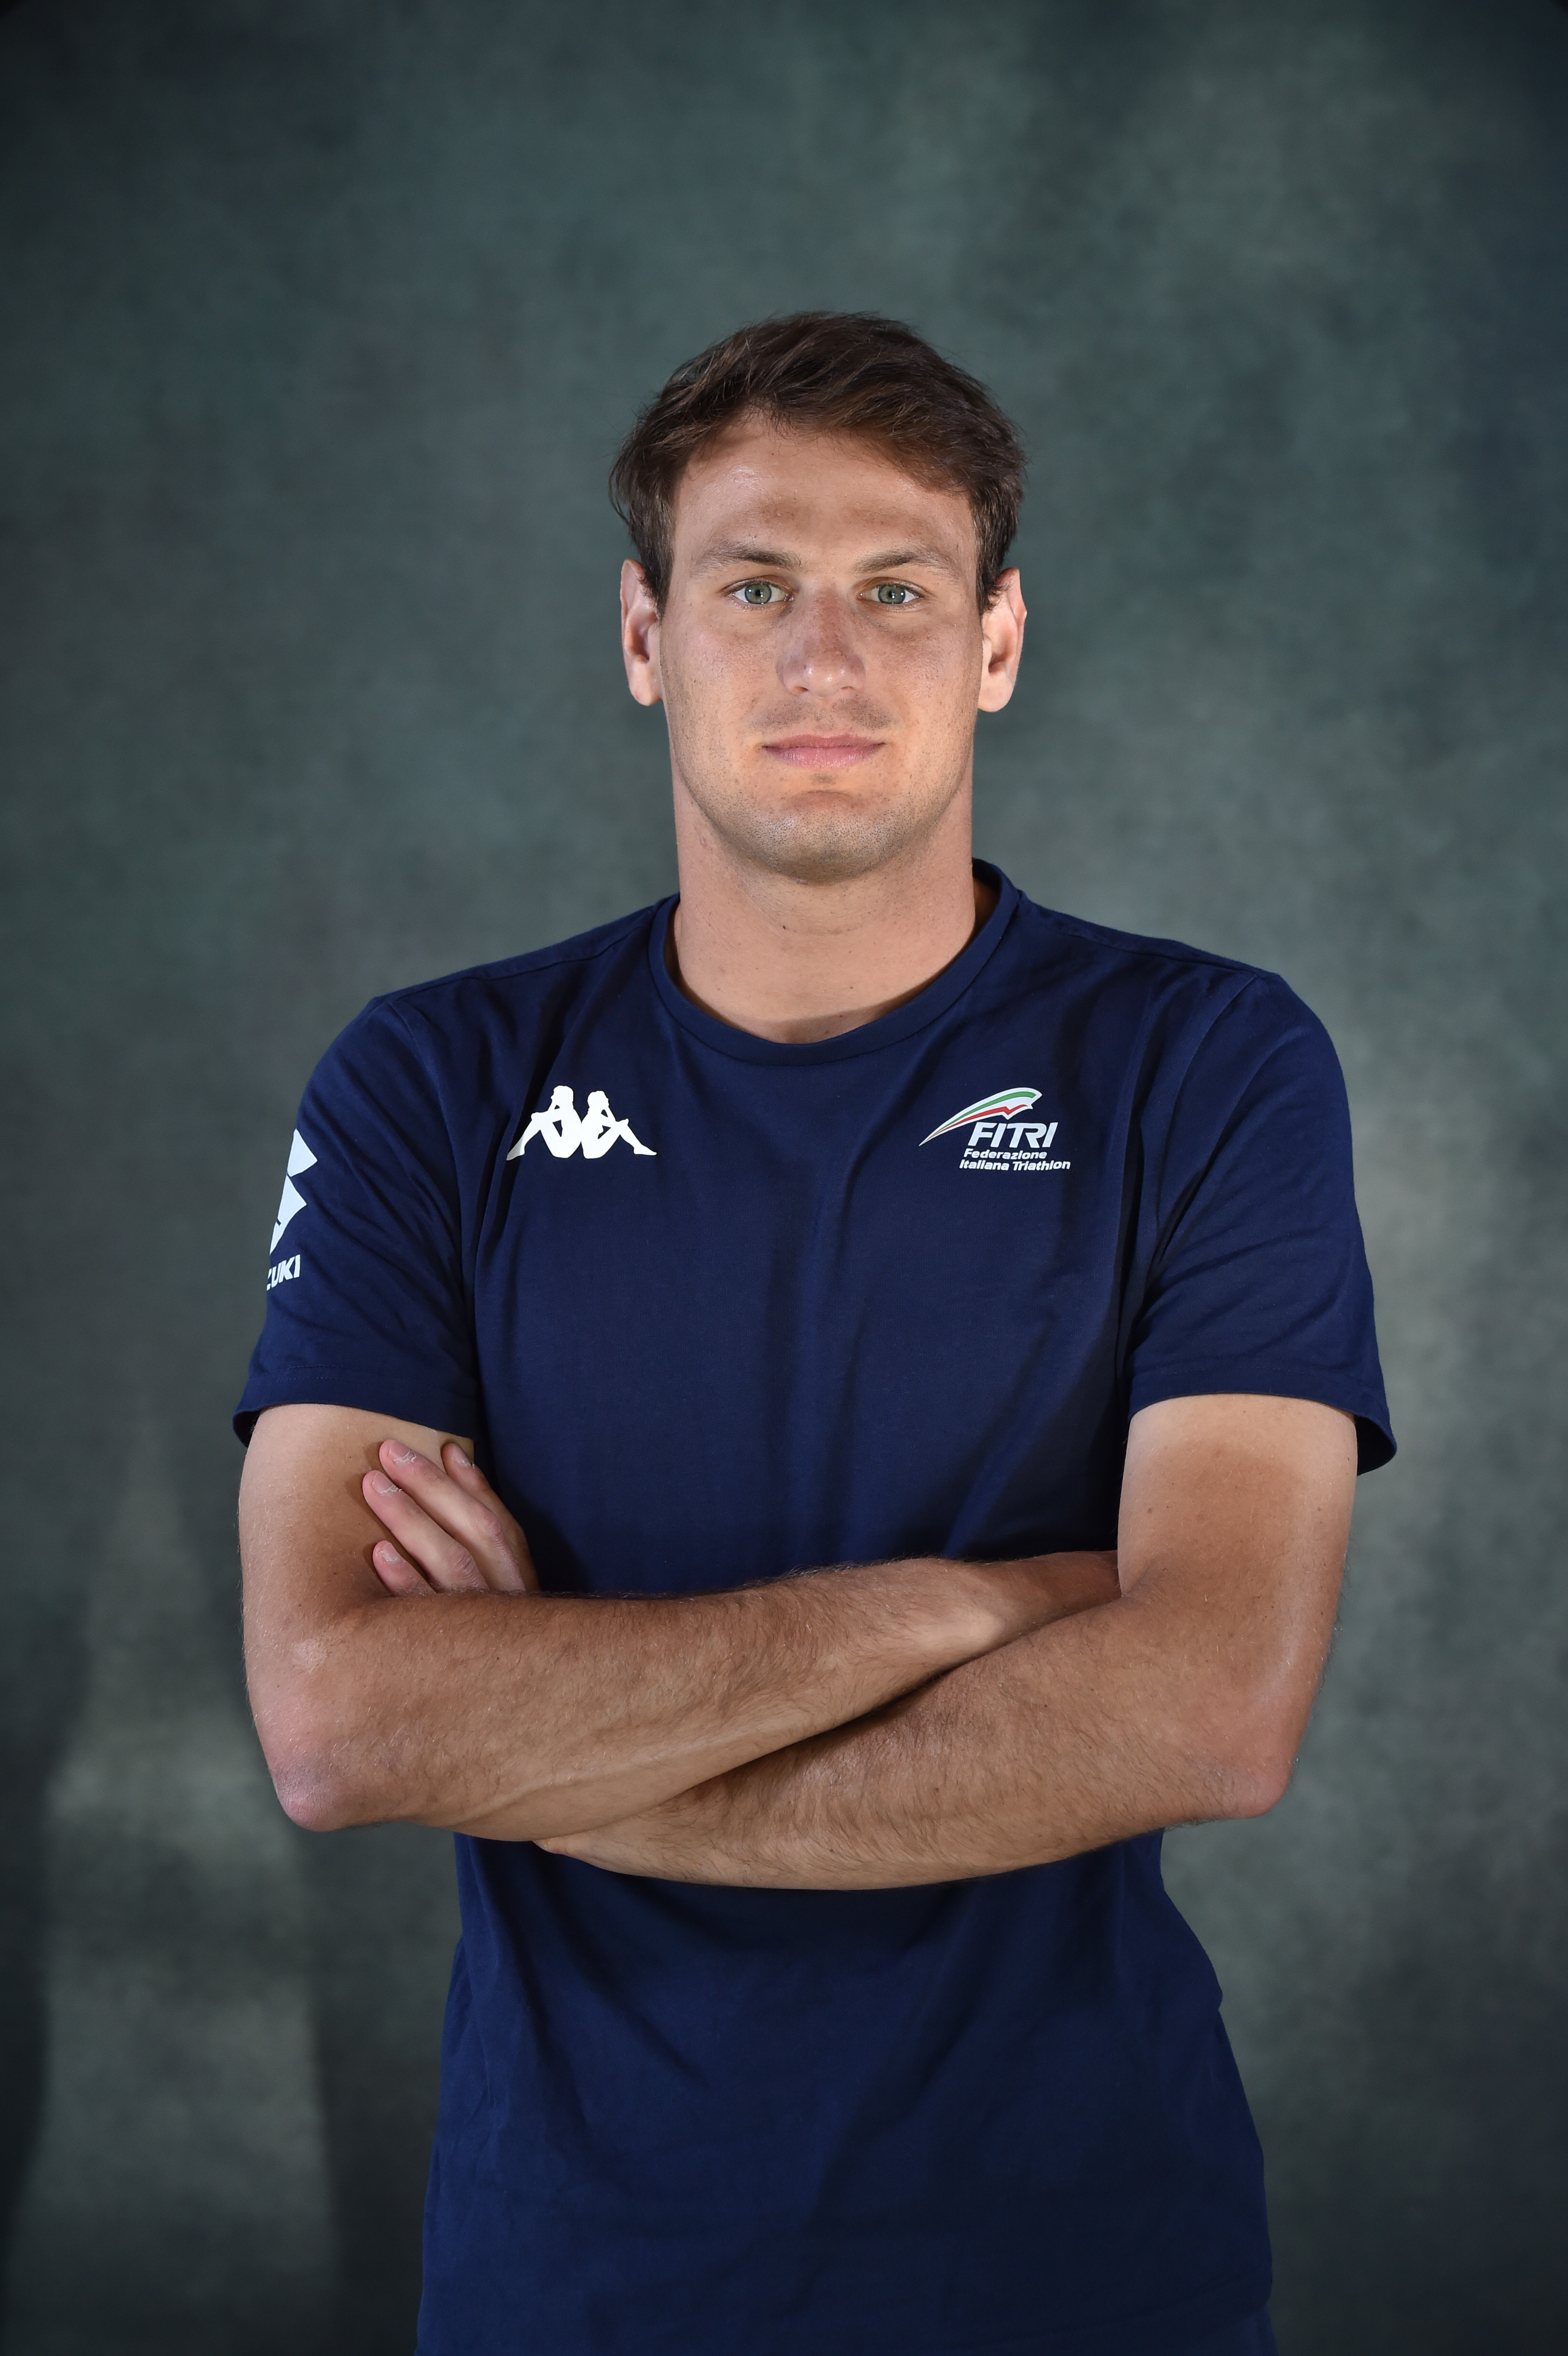 Nicola Azzano
ITA
|
+8 s
+6 s
|
G2 / G2
correct
|
5:00
5:09
|
16:19 | Show detailsPlacementPrediction: 5
80% range: 7–14
Top-10 probability: 51 %
Result: 1
Deviation: 4
SwimmingPrognoseabstand: +8 s
Time: 3:17
Pace: 1:13 / 100 m
Ergebnisabstand: +6 s
Fehler: 1.5 s
H2H: 3 Gegner:innen,
4 Duelle,
Korrektur 0.30 %,
Sicherheit 11 %
CyclingPrediction: Group 2 (9 people)
Gruppe 1: 65 %
Speed: 43.4 km/h
Gap ahead:
0.6 s
Gap behind:
1.1 s
Result: Group 2 (10 people)
Speed: 40.2 km/h
Tempo-Fehler: 3.26 km/h
Running and totalRun: 5:00 (2:56 / km)
Historical basis: 2:56 / km
Best comparable pace: 2:49 / km
Trend: +0:00 / km
Comparable races: 7
Fallback calculation from other run distances
H2H: 3 Gegner:innen,
4 Duelle,
Korrektur -0.01 %,
Sicherheit 7 %
Ergebnis Lauf: 5:09 (3:02 / km)
Error: −0:09 / −0:06 / km
Overall prediction: 16:19
Data basis: 12 Races · Confidence 1.00
Swimming:
3:17
(1:13 / 100 m)
To the end of cycling (group time):
11:03
(43.4 km/h)
Run:
5:00
(2:56 / km)
Total:
16:19
Target first bike group at the bike finishGoal: finish the bike split with the first bike group.
Estimated requirement:
Swim time: 3:14
Pace: 1:12 / 100 m
About 2.6 s faster in the swim
Maximum predicted gap after the swim: +4.9 s
The complete bike-group simulation, including catches and group mergers, is recalculated through the end of the bike split.
|
| 6 / 7 |
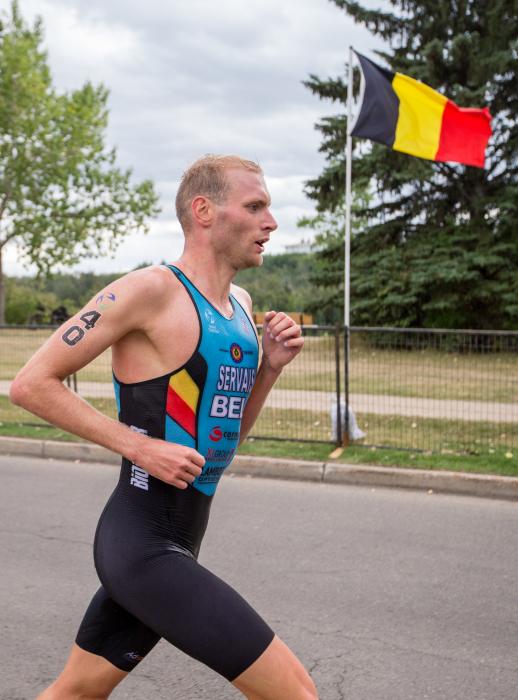 Noah Servais
BEL
|
+11 s
+9 s
|
G2 / G2
correct
|
5:04
5:13
|
16:23 | Show detailsPlacementPrediction: 6
80% range: 6–18
Top-10 probability: 39 %
Result: 7
Deviation: -1
SwimmingPrognoseabstand: +11 s
Time: 3:20
Pace: 1:14 / 100 m
Ergebnisabstand: +9 s
Fehler: 2.3 s
CyclingPrediction: Group 2 (9 people)
Gruppe 1: 51 %
Speed: 43.4 km/h
Gap ahead:
0.3 s
Gap behind:
1.5 s
Result: Group 2 (10 people)
Speed: 40.1 km/h
Tempo-Fehler: 3.32 km/h
Running and totalRun: 5:04 (2:59 / km)
Historical basis: 2:59 / km
Best comparable pace: 2:48 / km
Trend: +0:00 / km
Comparable races: 10
Fallback calculation from other run distances
Ergebnis Lauf: 5:13 (3:04 / km)
Error: −0:09 / −0:05 / km
Overall prediction: 16:23
Data basis: 12 Races · Confidence 1.00
Swimming:
3:20
(1:14 / 100 m)
To the end of cycling (group time):
11:03
(43.4 km/h)
Run:
5:04
(2:59 / km)
Total:
16:23
Target first bike group at the bike finishGoal: finish the bike split with the first bike group.
Estimated requirement:
Swim time: 3:14
Pace: 1:12 / 100 m
About 6.4 s faster in the swim
Maximum predicted gap after the swim: +4.9 s
The complete bike-group simulation, including catches and group mergers, is recalculated through the end of the bike split.
|
| 7 / 20 |
 Filip Vaclavik
CZE
|
+24 s
+17 s
|
G3 / G4
|
4:42
5:33
|
16:26 | Show detailsPlacementPrediction: 7
80% range: 6–16
Top-10 probability: 51 %
Result: 20
Deviation: -13
SwimmingPrognoseabstand: +24 s
Time: 3:33
Pace: 1:19 / 100 m
Ergebnisabstand: +17 s
Fehler: 7.0 s
CyclingPrediction: Group 3 (8 people)
Gruppe 1: 31 %
Speed: 43.1 km/h
Gap ahead:
2.6 s
Gap behind:
1.3 s
Result: Group 4 (5 people)
Speed: 36.7 km/h
Tempo-Fehler: 6.39 km/h
Running and totalRun: 4:42 (2:46 / km)
Historical basis: 2:46 / km
Best comparable pace: 2:46 / km
Trend: +0:00 / km
Comparable races: 1
Fallback calculation from other run distances
Ergebnis Lauf: 5:33 (3:16 / km)
Error: −0:51 / −0:30 / km
Overall prediction: 16:26
Data basis: 12 Races · Confidence 1.00
Swimming:
3:33
(1:19 / 100 m)
To the end of cycling (group time):
11:09
(43.1 km/h)
Run:
4:42
(2:46 / km)
Total:
16:26
Target first bike group at the bike finishGoal: finish the bike split with the first bike group.
Estimated requirement:
Swim time: 3:14
Pace: 1:12 / 100 m
About 19.1 s faster in the swim
Maximum predicted gap after the swim: +4.9 s
The complete bike-group simulation, including catches and group mergers, is recalculated through the end of the bike split.
|
| 8 / 17 |
Valdemar Solok
DEN
|
+15 s
+17 s
|
G2 / G3
|
5:09
5:48
|
16:28 | Show detailsPlacementPrediction: 8
80% range: 11–16
Top-10 probability: 5 %
Result: 17
Deviation: -9
SwimmingPrognoseabstand: +15 s
Time: 3:24
Pace: 1:16 / 100 m
Ergebnisabstand: +17 s
Fehler: -1.6 s
H2H: 7 Gegner:innen,
8 Duelle,
Korrektur 0.25 %,
Sicherheit 21 %
CyclingPrediction: Group 2 (9 people)
Gruppe 1: 21 %
Speed: 43.4 km/h
Gap ahead:
1.8 s
Gap behind:
6.0 s
Result: Group 3 (4 people)
Speed: 38.6 km/h
Tempo-Fehler: 4.88 km/h
Running and totalRun: 5:09 (3:02 / km)
Historical basis: 3:03 / km
Best comparable pace: 3:03 / km
Trend: +0:00 / km
Comparable races: 2
H2H: 7 Gegner:innen,
8 Duelle,
Korrektur -0.47 %,
Sicherheit 15 %
Ergebnis Lauf: 5:48 (3:25 / km)
Error: −0:39 / −0:23 / km
Overall prediction: 16:28
Data basis: 12 Races · Confidence 1.00
Swimming:
3:24
(1:16 / 100 m)
To the end of cycling (group time):
11:03
(43.4 km/h)
Run:
5:09
(3:02 / km)
Total:
16:28
Target first bike group at the bike finishGoal: finish the bike split with the first bike group.
Estimated requirement:
Swim time: 3:14
Pace: 1:12 / 100 m
About 10.5 s faster in the swim
Maximum predicted gap after the swim: +4.9 s
The complete bike-group simulation, including catches and group mergers, is recalculated through the end of the bike split.
|
| 9 / 4 |
 Alexis Lherieau
SUI
|
+25 s
+4 s
|
G3 / G1
|
4:54
5:24
|
16:38 | Show detailsPlacementPrediction: 9
80% range: 8–17
Top-10 probability: 35 %
Result: 4
Deviation: 5
SwimmingPrognoseabstand: +25 s
Time: 3:34
Pace: 1:19 / 100 m
Ergebnisabstand: +4 s
Fehler: 21.3 s
H2H: 2 Gegner:innen,
2 Duelle,
Korrektur 0.35 %,
Sicherheit 2 %
CyclingPrediction: Group 3 (8 people)
Gruppe 1: 23 %
Speed: 43.1 km/h
Gap ahead:
1.3 s
Gap behind:
2.8 s
Result: Group 1 (4 people)
Speed: 41.0 km/h
Tempo-Fehler: 2.05 km/h
Running and totalRun: 4:54 (2:53 / km)
Historical basis: 2:54 / km
Best comparable pace: 2:54 / km
Trend: −0:02 / km
Comparable races: 4
Fallback calculation from other run distances
H2H: 2 Gegner:innen,
2 Duelle,
Korrektur 0.53 %,
Sicherheit 2 %
Ergebnis Lauf: 5:24 (3:11 / km)
Error: −0:30 / −0:18 / km
Overall prediction: 16:38
Data basis: 12 Races · Confidence 1.00
Swimming:
3:34
(1:19 / 100 m)
To the end of cycling (group time):
11:09
(43.1 km/h)
Run:
4:54
(2:53 / km)
Total:
16:38
Target first bike group at the bike finishGoal: finish the bike split with the first bike group.
Estimated requirement:
Swim time: 3:14
Pace: 1:12 / 100 m
About 20.4 s faster in the swim
Maximum predicted gap after the swim: +4.9 s
The complete bike-group simulation, including catches and group mergers, is recalculated through the end of the bike split.
|
| 10 / 3 |
 Jan Bader
AUT
|
+32 s
+9 s
|
G3 / G1
|
5:02
5:13
|
16:46 | Show detailsPlacementPrediction: 10
80% range: 10–19
Top-10 probability: 14 %
Result: 3
Deviation: 7
SwimmingPrognoseabstand: +32 s
Time: 3:41
Pace: 1:22 / 100 m
Ergebnisabstand: +9 s
Fehler: 23.2 s
H2H: 7 Gegner:innen,
11 Duelle,
Korrektur -0.30 %,
Sicherheit 23 %
CyclingPrediction: Group 3 (8 people)
Gruppe 1: 18 %
Speed: 43.1 km/h
Gap ahead:
3.1 s
Gap behind:
2.1 s
Result: Group 1 (4 people)
Speed: 40.3 km/h
Tempo-Fehler: 2.74 km/h
Running and totalRun: 5:02 (2:58 / km)
Historical basis: 2:57 / km
Best comparable pace: 2:57 / km
Trend: +0:00 / km
Comparable races: 1
H2H: 7 Gegner:innen,
11 Duelle,
Korrektur 0.11 %,
Sicherheit 16 %
Ergebnis Lauf: 5:13 (3:04 / km)
Error: −0:11 / −0:07 / km
Overall prediction: 16:46
Data basis: 12 Races · Confidence 1.00
Swimming:
3:41
(1:22 / 100 m)
To the end of cycling (group time):
11:09
(43.1 km/h)
Run:
5:02
(2:58 / km)
Total:
16:46
Target first bike group at the bike finishGoal: finish the bike split with the first bike group.
Estimated requirement:
Swim time: 3:14
Pace: 1:12 / 100 m
About 27.3 s faster in the swim
Maximum predicted gap after the swim: +4.9 s
The complete bike-group simulation, including catches and group mergers, is recalculated through the end of the bike split.
|
| 11 / 9 |
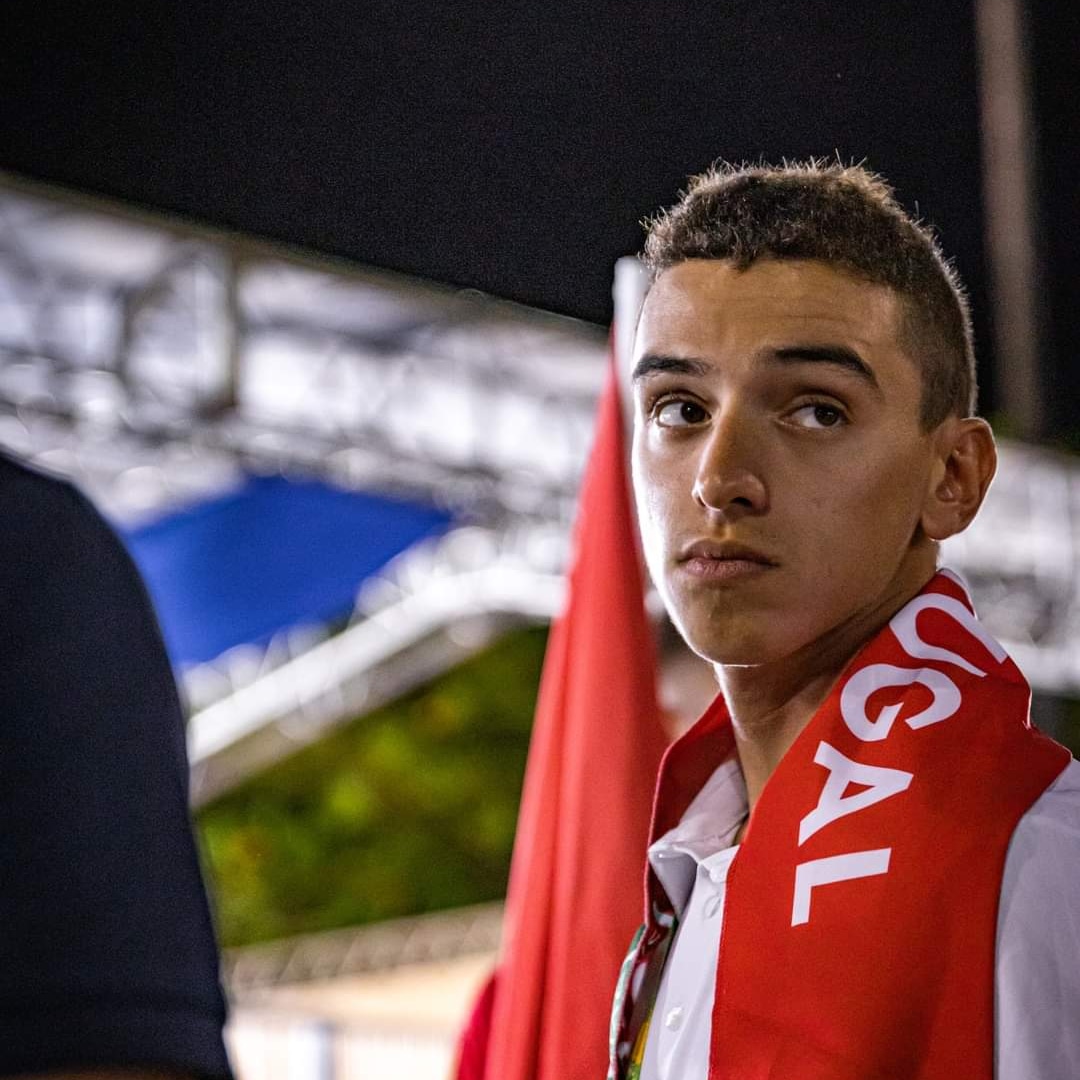 Gonçalo Oliveira
POR
|
+34 s
+9 s
|
G3 / G2
|
5:05
5:15
|
16:49 | Show detailsPlacementPrediction: 11
80% range: 13–21
Top-10 probability: 3 %
Result: 9
Deviation: 2
SwimmingPrognoseabstand: +34 s
Time: 3:43
Pace: 1:23 / 100 m
Ergebnisabstand: +9 s
Fehler: 25.3 s
CyclingPrediction: Group 3 (8 people)
Gruppe 1: 9 %
Speed: 43.1 km/h
Gap ahead:
2.1 s
Gap behind:
0.7 s
Result: Group 2 (10 people)
Speed: 40.2 km/h
Tempo-Fehler: 2.91 km/h
Running and totalRun: 5:05 (2:59 / km)
Historical basis: 2:59 / km
Best comparable pace: 2:59 / km
Trend: +0:00 / km
Comparable races: 1
Fallback calculation from other run distances
Ergebnis Lauf: 5:15 (3:05 / km)
Error: −0:10 / −0:06 / km
Overall prediction: 16:49
Data basis: 12 Races · Confidence 1.00
Swimming:
3:43
(1:23 / 100 m)
To the end of cycling (group time):
11:09
(43.1 km/h)
Run:
5:05
(2:59 / km)
Total:
16:49
Target first bike group at the bike finishGoal: finish the bike split with the first bike group.
Estimated requirement:
Swim time: 3:14
Pace: 1:12 / 100 m
About 29.4 s faster in the swim
Maximum predicted gap after the swim: +4.9 s
The complete bike-group simulation, including catches and group mergers, is recalculated through the end of the bike split.
|
| 12 / 12 |
_-_JR2017.JPG) James Chantler-Mayne
James Chantler-Mayne
GBR
|
+28 s
+11 s
|
G3 / G2
|
5:07
5:33
|
16:51 | Show detailsPlacementPrediction: 12
80% range: 11–23
Top-10 probability: 10 %
Result: 12
Deviation: 0
SwimmingPrognoseabstand: +28 s
Time: 3:37
Pace: 1:20 / 100 m
Ergebnisabstand: +11 s
Fehler: 17.1 s
CyclingPrediction: Group 3 (8 people)
Gruppe 1: 14 %
Speed: 43.1 km/h
Gap ahead:
2.8 s
Gap behind:
1.0 s
Result: Group 2 (10 people)
Speed: 40.3 km/h
Tempo-Fehler: 2.74 km/h
Running and totalRun: 5:07 (3:01 / km)
Historical basis: 3:01 / km
Best comparable pace: 2:53 / km
Trend: +0:00 / km
Comparable races: 3
Fallback calculation from other run distances
Ergebnis Lauf: 5:33 (3:16 / km)
Error: −0:26 / −0:15 / km
Overall prediction: 16:51
Data basis: 12 Races · Confidence 1.00
Swimming:
3:37
(1:20 / 100 m)
To the end of cycling (group time):
11:09
(43.1 km/h)
Run:
5:07
(3:01 / km)
Total:
16:51
Target first bike group at the bike finishGoal: finish the bike split with the first bike group.
Estimated requirement:
Swim time: 3:14
Pace: 1:12 / 100 m
About 23.2 s faster in the swim
Maximum predicted gap after the swim: +4.9 s
The complete bike-group simulation, including catches and group mergers, is recalculated through the end of the bike split.
|
| 13 / 13 |
Mateusz Gluszkowski
POL
|
+6 s
+0 s
|
G2 / G2
correct
|
5:46
5:35
|
17:05 | Show detailsPlacementPrediction: 13
80% range: 15–20
Top-10 probability: 0 %
Result: 13
Deviation: 0
SwimmingPrognoseabstand: +6 s
Time: 3:15
Pace: 1:12 / 100 m
Ergebnisabstand: +0 s
Fehler: 6.0 s
H2H: 5 Gegner:innen,
8 Duelle,
Korrektur -0.11 %,
Sicherheit 19 %
CyclingPrediction: Group 2 (9 people)
Gruppe 1: 74 %
Speed: 43.4 km/h
Gap ahead:
5.0 s
Gap behind:
0.9 s
Result: Group 2 (10 people)
Speed: 40.0 km/h
Tempo-Fehler: 3.43 km/h
Running and totalRun: 5:46 (3:24 / km)
Historical basis: 3:24 / km
Best comparable pace: 3:24 / km
Trend: +0:00 / km
Comparable races: 2
H2H: 5 Gegner:innen,
8 Duelle,
Korrektur 0.08 %,
Sicherheit 11 %
Ergebnis Lauf: 5:35 (3:17 / km)
Error: +0:11 / +0:07 / km
Overall prediction: 17:05
Data basis: 12 Races · Confidence 1.00
Swimming:
3:15
(1:12 / 100 m)
To the end of cycling (group time):
11:03
(43.4 km/h)
Run:
5:46
(3:24 / km)
Total:
17:05
Target first bike group at the bike finish
Cannot be calculated without a swim distance or historical swim data.
|
| 14 / 24 |
Burak Cağdaş
TUR
|
+35 s
+16 s
|
G3 / G5
|
5:26
6:50
|
17:10 | Show detailsPlacementPrediction: 14
80% range: 19–23
Top-10 probability: 0 %
Result: 24
Deviation: -10
SwimmingPrognoseabstand: +35 s
Time: 3:44
Pace: 1:23 / 100 m
Ergebnisabstand: +16 s
Fehler: 19.0 s
CyclingPrediction: Group 3 (8 people)
Gruppe 1: 0 %
Speed: 43.1 km/h
Gap ahead:
0.7 s
Gap behind:
2.8 s
Result: Group 5 (1 people)
Speed: 32.6 km/h
Tempo-Fehler: 10.46 km/h
Running and totalRun: 5:26 (3:12 / km)
Historical basis: 3:12 / km
Best comparable pace: 3:12 / km
Trend: +0:00 / km
Comparable races: 1
Fallback calculation from other run distances
Ergebnis Lauf: 6:50 (4:01 / km)
Error: −1:24 / −0:49 / km
Overall prediction: 17:10
Data basis: 9 Races · Confidence 1.00
Swimming:
3:44
(1:23 / 100 m)
To the end of cycling (group time):
11:09
(43.1 km/h)
Run:
5:26
(3:12 / km)
Total:
17:10
Target first bike group at the bike finishGoal: finish the bike split with the first bike group.
Estimated requirement:
Swim time: 3:14
Pace: 1:12 / 100 m
About 30.1 s faster in the swim
Maximum predicted gap after the swim: +4.9 s
The complete bike-group simulation, including catches and group mergers, is recalculated through the end of the bike split.
|
| 15 / 16 |
Tomas Kriz
CZE
|
+29 s
+14 s
|
G3 / G3
correct
|
5:28
5:39
|
17:12 | Show detailsPlacementPrediction: 15
80% range: 16–23
Top-10 probability: 0 %
Result: 16
Deviation: -1
SwimmingPrognoseabstand: +29 s
Time: 3:38
Pace: 1:21 / 100 m
Ergebnisabstand: +14 s
Fehler: 15.1 s
H2H: 5 Gegner:innen,
8 Duelle,
Korrektur 0.75 %,
Sicherheit 17 %
CyclingPrediction: Group 3 (8 people)
Gruppe 1: 19 %
Speed: 43.1 km/h
Gap ahead:
1.0 s
Gap behind:
3.1 s
Result: Group 3 (4 people)
Speed: 38.6 km/h
Tempo-Fehler: 4.52 km/h
Running and totalRun: 5:28 (3:13 / km)
Historical basis: 3:12 / km
Best comparable pace: 2:54 / km
Trend: +0:00 / km
Comparable races: 6
Fallback calculation from other run distances
H2H: 5 Gegner:innen,
8 Duelle,
Korrektur 0.86 %,
Sicherheit 9 %
Ergebnis Lauf: 5:39 (3:19 / km)
Error: −0:11 / −0:06 / km
Overall prediction: 17:12
Data basis: 12 Races · Confidence 1.00
Swimming:
3:38
(1:21 / 100 m)
To the end of cycling (group time):
11:09
(43.1 km/h)
Run:
5:28
(3:13 / km)
Total:
17:12
Target first bike group at the bike finishGoal: finish the bike split with the first bike group.
Estimated requirement:
Swim time: 3:14
Pace: 1:12 / 100 m
About 24.2 s faster in the swim
Maximum predicted gap after the swim: +4.9 s
The complete bike-group simulation, including catches and group mergers, is recalculated through the end of the bike split.
|
| 16 / 23 |
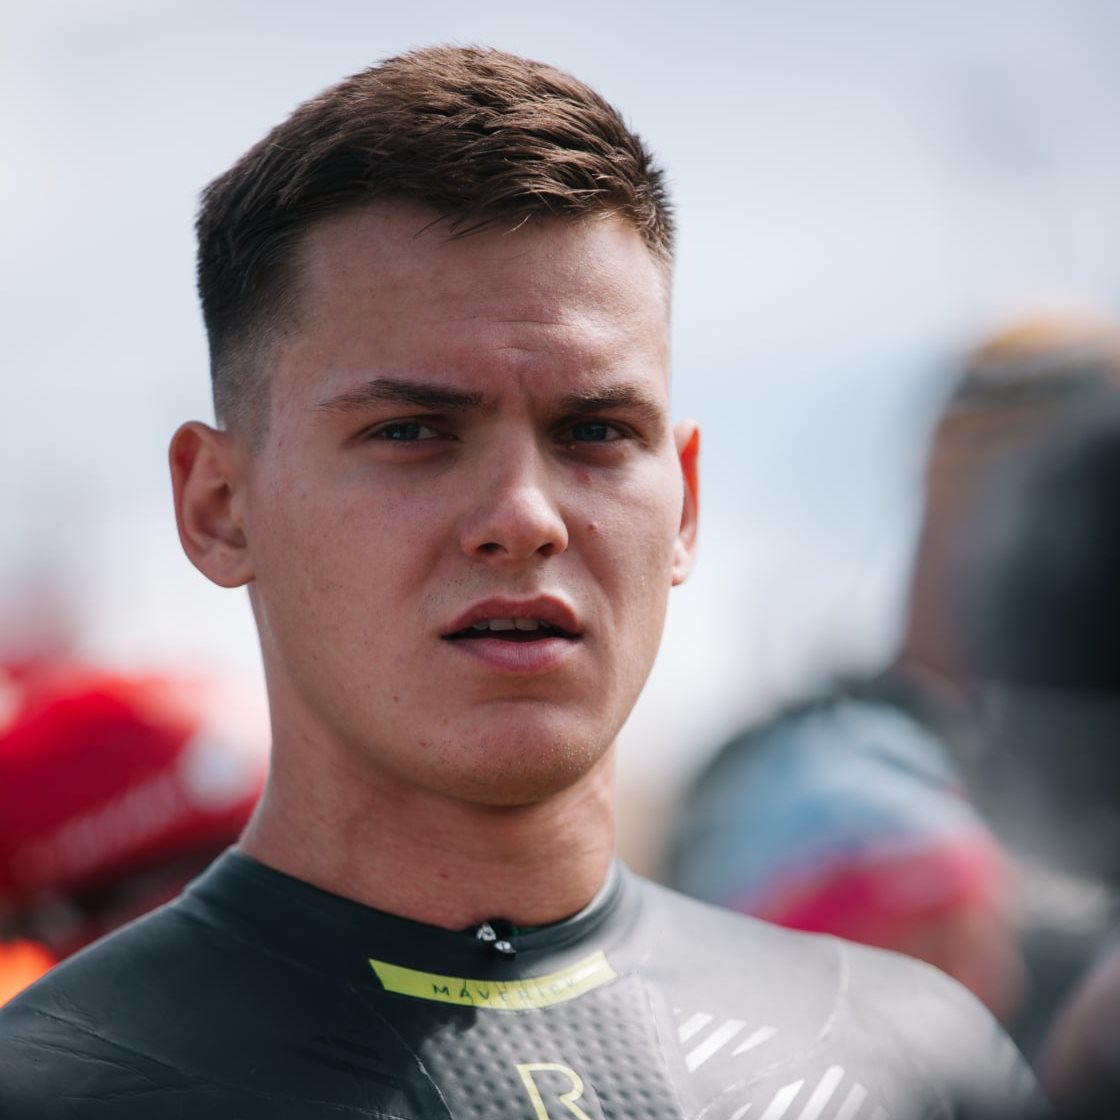 Povilas Strazdas
LTU
|
+9 s
+14 s
|
G2 / G4
|
5:57
6:27
|
17:16 | Show detailsPlacementPrediction: 16
80% range: 18–23
Top-10 probability: 0 %
Result: 23
Deviation: -7
SwimmingPrognoseabstand: +9 s
Time: 3:18
Pace: 1:13 / 100 m
Ergebnisabstand: +14 s
Fehler: -5.4 s
H2H: 5 Gegner:innen,
8 Duelle,
Korrektur -0.72 %,
Sicherheit 17 %
CyclingPrediction: Group 2 (9 people)
Gruppe 1: 63 %
Speed: 43.4 km/h
Gap ahead:
1.1 s
Gap behind:
2.4 s
Result: Group 4 (5 people)
Speed: 36.9 km/h
Tempo-Fehler: 6.55 km/h
Running and totalRun: 5:57 (3:30 / km)
Historical basis: 3:32 / km
Best comparable pace: 3:32 / km
Trend: +0:00 / km
Comparable races: 2
H2H: 5 Gegner:innen,
8 Duelle,
Korrektur -0.92 %,
Sicherheit 11 %
Ergebnis Lauf: 6:27 (3:48 / km)
Error: −0:30 / −0:18 / km
Overall prediction: 17:16
Data basis: 4 Races · Confidence 0.80
Swimming:
3:18
(1:13 / 100 m)
To the end of cycling (group time):
11:03
(43.4 km/h)
Run:
5:57
(3:30 / km)
Total:
17:16
Target first bike group at the bike finishGoal: finish the bike split with the first bike group.
Estimated requirement:
Swim time: 3:14
Pace: 1:12 / 100 m
About 3.7 s faster in the swim
Maximum predicted gap after the swim: +4.9 s
The complete bike-group simulation, including catches and group mergers, is recalculated through the end of the bike split.
|
| 17 / 8 |
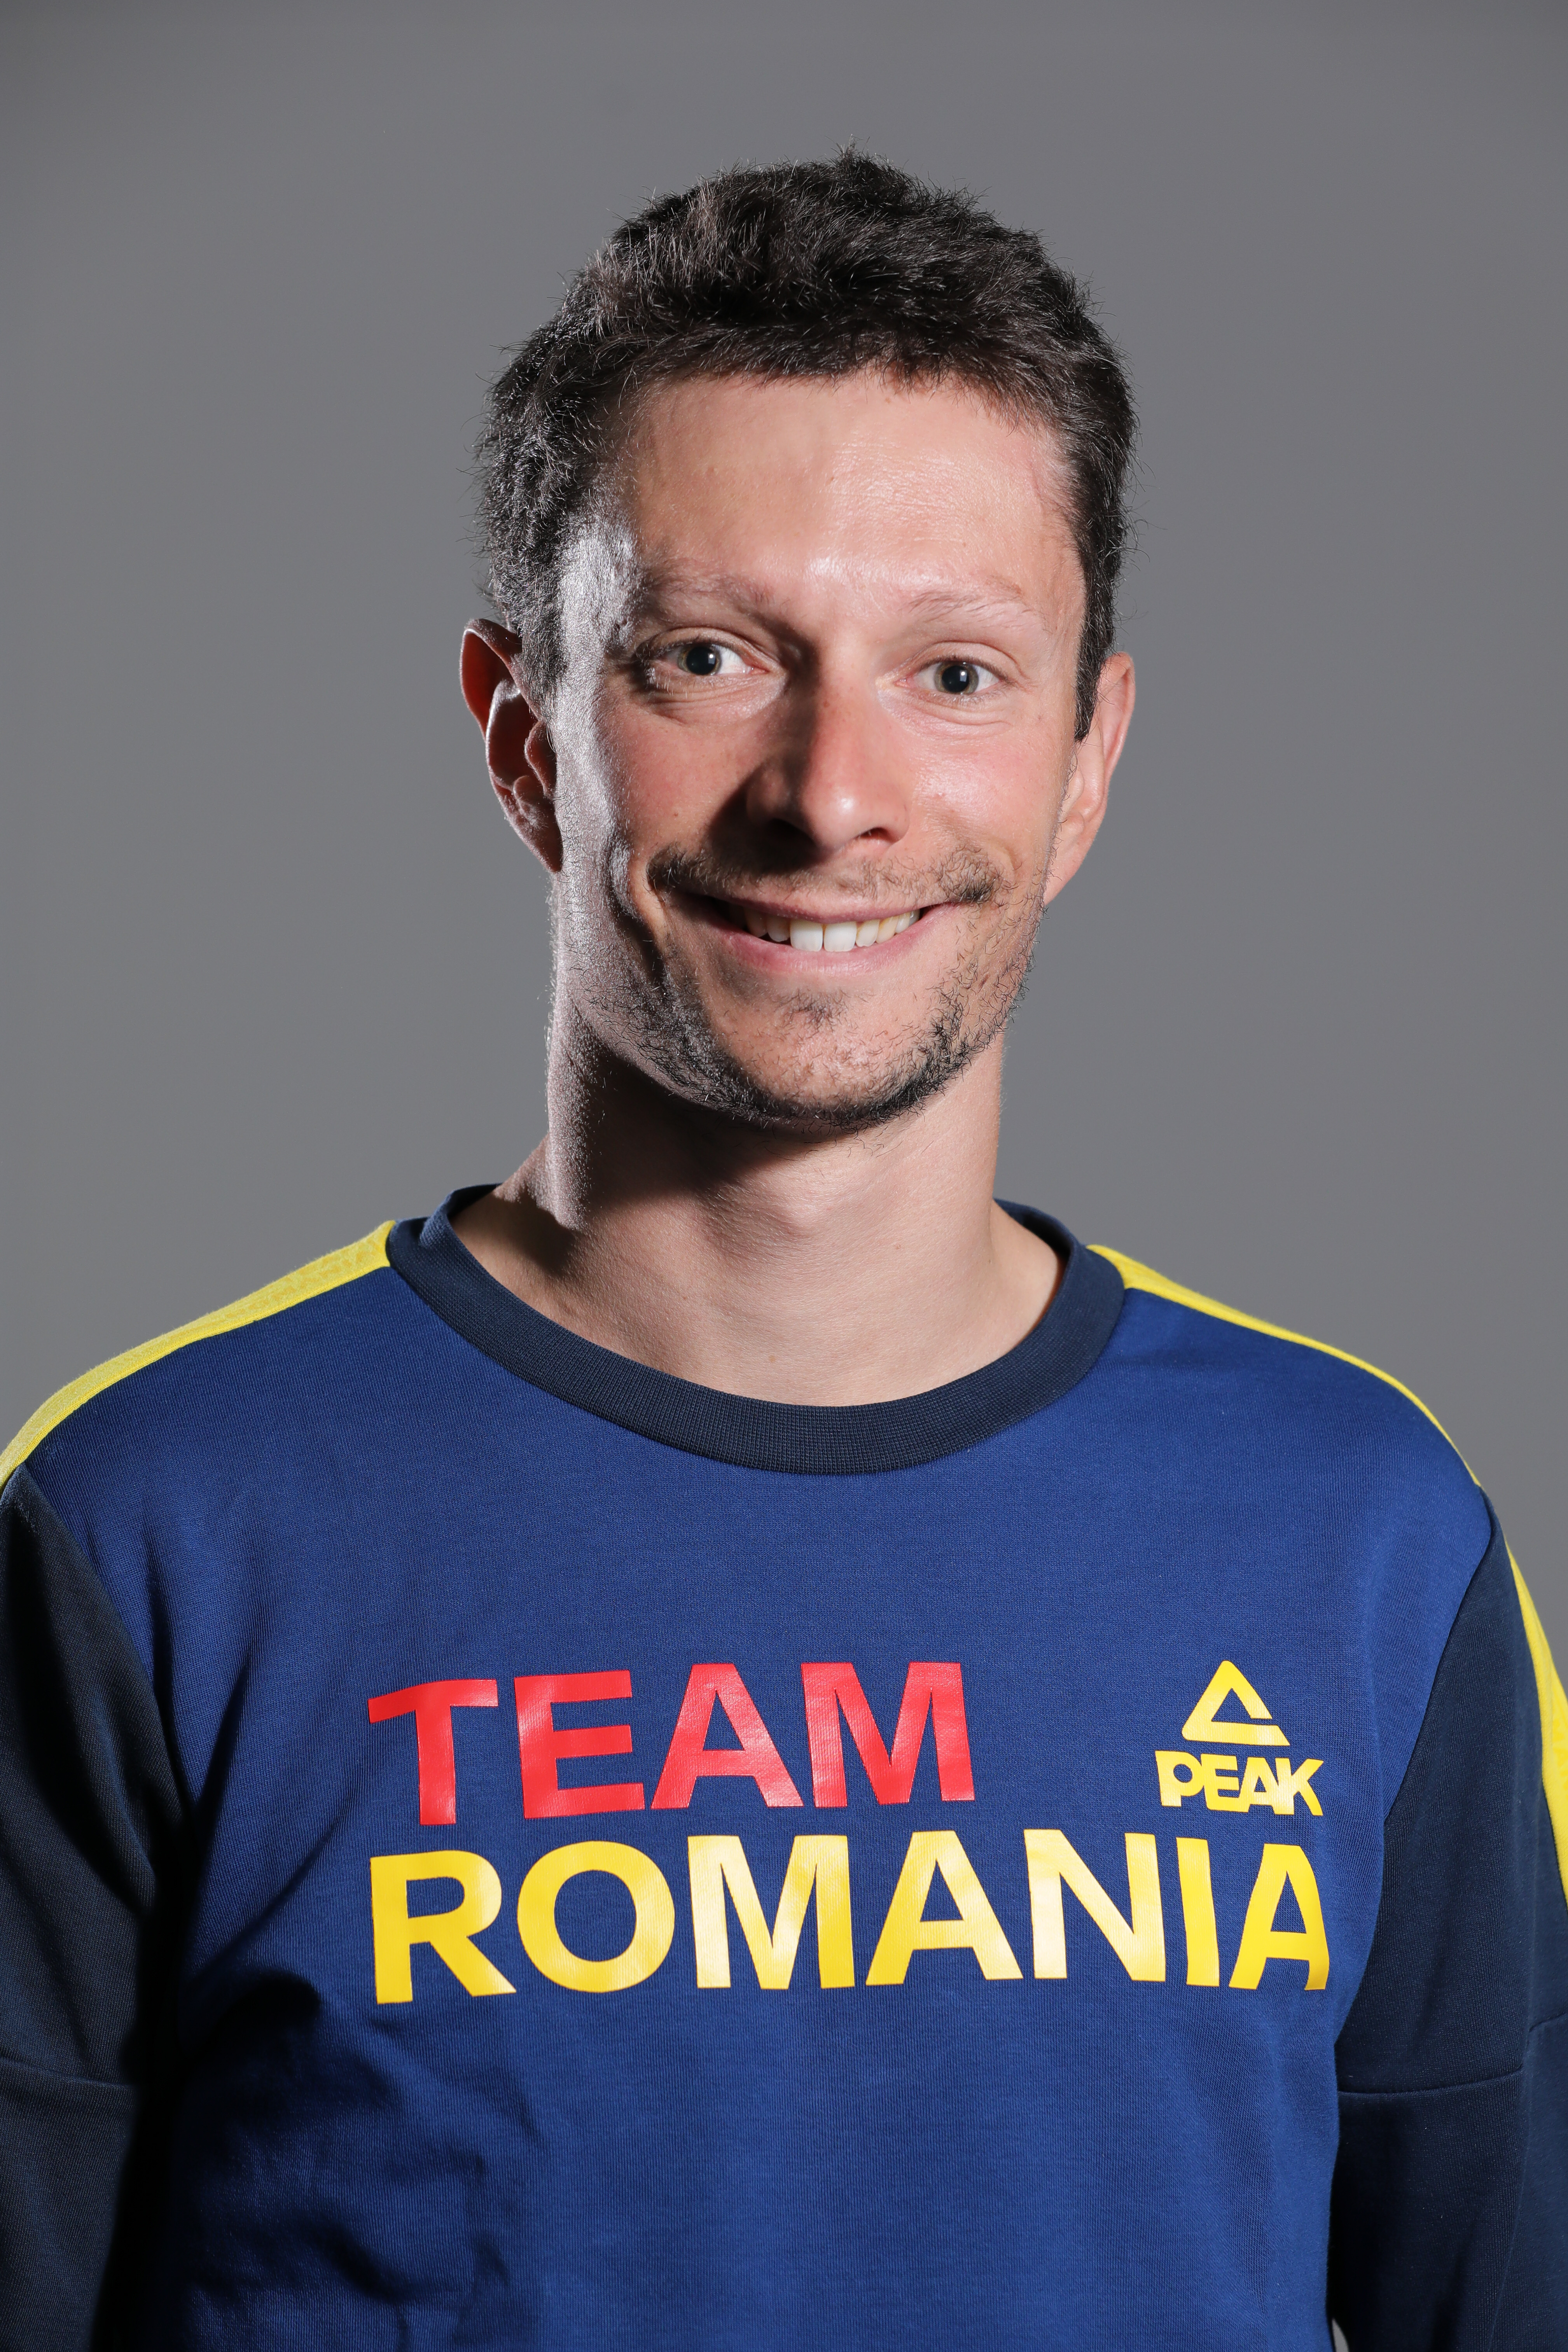 Felix Duchampt
ROU
|
+38 s
+11 s
|
G4 / G2
|
4:59
5:14
|
17:20 | Show detailsPlacementPrediction: 17
80% range: 10–23
Top-10 probability: 14 %
Result: 8
Deviation: 9
SwimmingPrognoseabstand: +38 s
Time: 3:47
Pace: 1:24 / 100 m
Ergebnisabstand: +11 s
Fehler: 26.8 s
CyclingPrediction: Group 4 (2 people)
Gruppe 1: 14 %
Speed: 40.9 km/h
Gap ahead:
2.8 s
Gap behind:
0.1 s
Result: Group 2 (10 people)
Speed: 40.2 km/h
Tempo-Fehler: 0.78 km/h
Running and totalRun: 4:59 (2:56 / km)
Historical basis: 2:56 / km
Best comparable pace: 2:34 / km
Trend: +0:00 / km
Comparable races: 8
Fallback calculation from other run distances
Ergebnis Lauf: 5:14 (3:05 / km)
Error: −0:15 / −0:09 / km
Overall prediction: 17:20
Data basis: 12 Races · Confidence 1.00
Swimming:
3:47
(1:24 / 100 m)
To the end of cycling (group time):
11:43
(40.9 km/h)
Run:
4:59
(2:56 / km)
Total:
17:20
Target first bike group at the bike finishGoal: finish the bike split with the first bike group.
Estimated requirement:
Swim time: 3:14
Pace: 1:12 / 100 m
About 32.9 s faster in the swim
Maximum predicted gap after the swim: +4.9 s
The complete bike-group simulation, including catches and group mergers, is recalculated through the end of the bike split.
|
| 18 / 19 |
Emir Aracı
TUR
|
+21 s
+17 s
|
G3 / G4
|
5:46
5:31
|
17:30 | Show detailsPlacementPrediction: 18
80% range: 17–23
Top-10 probability: 0 %
Result: 19
Deviation: -1
SwimmingPrognoseabstand: +21 s
Time: 3:30
Pace: 1:18 / 100 m
Ergebnisabstand: +17 s
Fehler: 4.4 s
CyclingPrediction: Group 3 (8 people)
Gruppe 1: 24 %
Speed: 43.1 km/h
Gap ahead:
6.0 s
Gap behind:
2.6 s
Result: Group 4 (5 people)
Speed: 36.7 km/h
Tempo-Fehler: 6.34 km/h
Running and totalRun: 5:46 (3:24 / km)
Historical basis: 3:24 / km
Best comparable pace: 3:24 / km
Trend: +0:00 / km
Comparable races: 1
Ergebnis Lauf: 5:31 (3:15 / km)
Error: +0:15 / +0:09 / km
Overall prediction: 17:30
Data basis: 12 Races · Confidence 1.00
Swimming:
3:30
(1:18 / 100 m)
To the end of cycling (group time):
11:09
(43.1 km/h)
Run:
5:46
(3:24 / km)
Total:
17:30
Target first bike group at the bike finishGoal: finish the bike split with the first bike group.
Estimated requirement:
Swim time: 3:14
Pace: 1:12 / 100 m
About 16.5 s faster in the swim
Maximum predicted gap after the swim: +4.9 s
The complete bike-group simulation, including catches and group mergers, is recalculated through the end of the bike split.
|
| 19 / 2 |
 Itamar Levanon
ISR
|
+57 s
+10 s
|
G5 / G1
|
5:07
5:10
|
18:08 | Show detailsPlacementPrediction: 19
80% range: 18–24
Top-10 probability: 1 %
Result: 2
Deviation: 17
SwimmingPrognoseabstand: +57 s
Time: 4:06
Pace: 1:31 / 100 m
Ergebnisabstand: +10 s
Fehler: 47.4 s
H2H: 3 Gegner:innen,
4 Duelle,
Korrektur -0.71 %,
Sicherheit 11 %
CyclingPrediction: Group 5 (4 people)
Gruppe 1: 1 %
Speed: 40.2 km/h
Initial Gruppe 5, später eingeholt/vereinigt
Gap ahead:
19.5 s
Gap behind:
5.8 s
Result: Group 1 (4 people)
Speed: 40.3 km/h
Tempo-Fehler: -0.11 km/h
Running and totalRun: 5:07 (3:00 / km)
Historical basis: 3:01 / km
Best comparable pace: 2:50 / km
Trend: +0:00 / km
Comparable races: 7
Fallback calculation from other run distances
H2H: 3 Gegner:innen,
4 Duelle,
Korrektur -0.12 %,
Sicherheit 7 %
Ergebnis Lauf: 5:10 (3:02 / km)
Error: −0:03 / −0:02 / km
Overall prediction: 18:08
Data basis: 12 Races · Confidence 1.00
Swimming:
4:06
(1:31 / 100 m)
To the end of cycling (group time):
11:35
(40.2 km/h)
Run:
5:07
(3:00 / km)
Total:
18:08
Target first bike group at the bike finishGoal: finish the bike split with the first bike group.
Estimated requirement:
Swim time: 3:14
Pace: 1:12 / 100 m
About 52.5 s faster in the swim
Maximum predicted gap after the swim: +4.9 s
The complete bike-group simulation, including catches and group mergers, is recalculated through the end of the bike split.
|
| 0 / 11 |
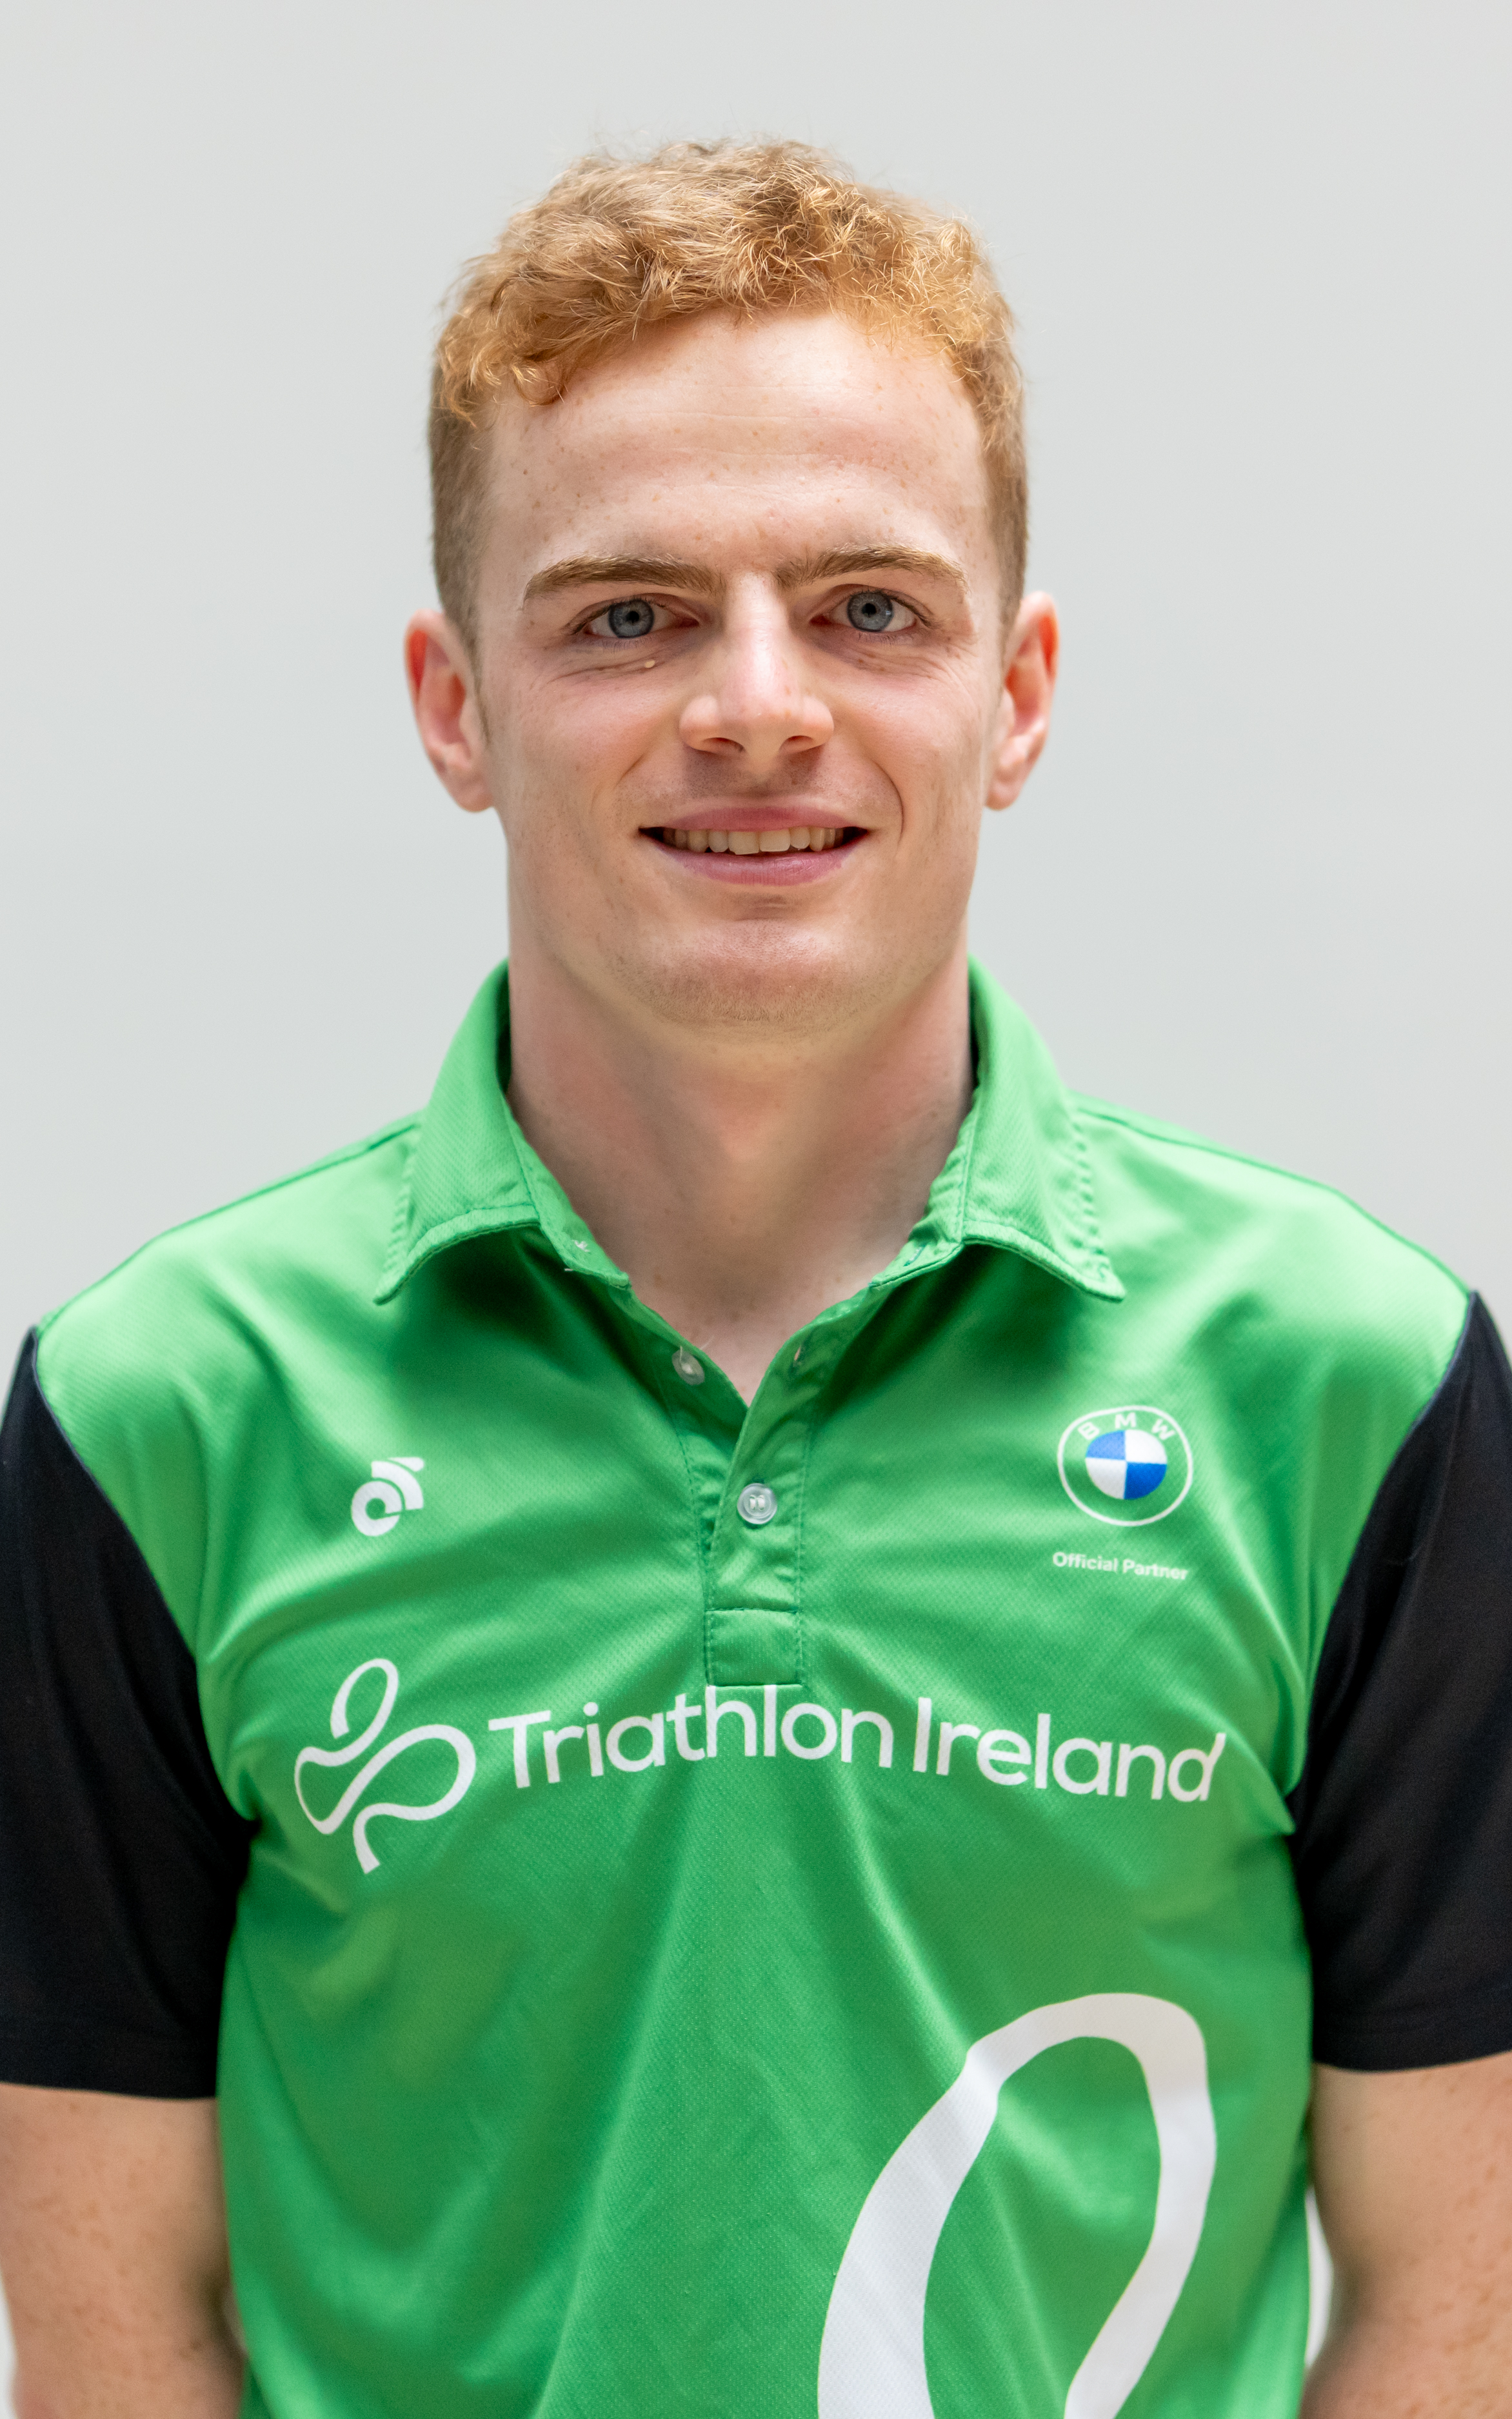 Jonathan Oakey
IRL
|
+38 s
+15 s
|
G4 / G2
|
5:36
|
Show detailsPlacementPrediction: 0
80% range: 2–3
Top-10 probability: 100 %
Result: 11
Deviation: -11
SwimmingPrognoseabstand: +38 s
Time: 3:47
Pace: 1:24 / 100 m
Ergebnisabstand: +15 s
Fehler: 22.9 s
CyclingPrediction: Group 4 (2 people)
Gruppe 1: 0 %
Speed: 40.9 km/h
Gap ahead:
0.1 s
Gap behind:
19.5 s
Result: Group 2 (10 people)
Speed: 40.9 km/h
Tempo-Fehler: 0.10 km/h
Running and totalRun: ()
Historical basis:
Best comparable pace:
Trend: +0:00 / km
Comparable races: 0
Fallback calculation from other run distances
Ergebnis Lauf: 5:36 (3:18 / km)
Error: /
Overall prediction:
Data basis: 7 Races · Confidence 1.00
Swimming:
3:47
(1:24 / 100 m)
To the end of cycling (group time):
11:43
(40.9 km/h)
Run:
–
Total:
not fully calculable
Target first bike group at the bike finishGoal: finish the bike split with the first bike group.
Estimated requirement:
Swim time: 3:14
Pace: 1:12 / 100 m
About 33 s faster in the swim
Maximum predicted gap after the swim: +4.9 s
The complete bike-group simulation, including catches and group mergers, is recalculated through the end of the bike split.
|
|
| 0 / 14 |
Axel Rosencrantz
SWE
|
+11 s
+17 s
|
G2 / G3
|
5:36
|
Show detailsPlacementPrediction: 0
80% range: 1–2
Top-10 probability: 100 %
Result: 14
Deviation: -14
SwimmingPrognoseabstand: +11 s
Time: 3:20
Pace: 1:14 / 100 m
Ergebnisabstand: +17 s
Fehler: -6.0 s
CyclingPrediction: Group 2 (9 people)
Gruppe 1: 54 %
Speed: 43.4 km/h
Gap ahead:
2.4 s
Gap behind:
0.3 s
Result: Group 3 (4 people)
Speed: 38.6 km/h
Tempo-Fehler: 4.82 km/h
Running and totalRun: ()
Historical basis:
Best comparable pace:
Trend: +0:00 / km
Comparable races: 0
Fallback calculation from other run distances
Ergebnis Lauf: 5:36 (3:18 / km)
Error: /
Overall prediction:
Data basis: 11 Races · Confidence 1.00
Swimming:
3:20
(1:14 / 100 m)
To the end of cycling (group time):
11:03
(43.4 km/h)
Run:
–
Total:
not fully calculable
Target first bike group at the bike finishGoal: finish the bike split with the first bike group.
Estimated requirement:
Swim time: 3:14
Pace: 1:12 / 100 m
About 6.1 s faster in the swim
Maximum predicted gap after the swim: +4.9 s
The complete bike-group simulation, including catches and group mergers, is recalculated through the end of the bike split.
|
|
| 0 / 18 |
 Jose Ignacio Galvez Ponce
ESP
|
+86 s
+17 s
|
G5 / G3
|
5:57
|
Show detailsPlacementPrediction: 0
80% range: 3–5
Top-10 probability: 100 %
Result: 18
Deviation: -18
SwimmingPrognoseabstand: +86 s
Time: 4:35
Pace: 1:42 / 100 m
Ergebnisabstand: +17 s
Fehler: 69.2 s
CyclingPrediction: Group 5 (4 people)
Gruppe 1: 0 %
Speed: 40.2 km/h
Initial Gruppe 7, später eingeholt/vereinigt
Gap ahead:
22.2 s
Gap behind:
–
Result: Group 3 (4 people)
Speed: 38.6 km/h
Tempo-Fehler: 1.62 km/h
Running and totalRun: ()
Historical basis:
Best comparable pace:
Trend: +0:00 / km
Comparable races: 0
Fallback calculation from other run distances
Ergebnis Lauf: 5:57 (3:30 / km)
Error: /
Overall prediction:
Data basis: 10 Races · Confidence 1.00
Swimming:
4:35
(1:42 / 100 m)
To the end of cycling (group time):
11:35
(40.2 km/h)
Run:
–
Total:
not fully calculable
Target first bike group at the bike finishGoal: finish the bike split with the first bike group.
Estimated requirement:
Swim time: 3:14
Pace: 1:12 / 100 m
About 81.3 s faster in the swim
Maximum predicted gap after the swim: +4.9 s
The complete bike-group simulation, including catches and group mergers, is recalculated through the end of the bike split.
|
|
| 0 / 21 |
 Ivan Shevchenko
UKR
|
+63 s
+15 s
|
G5 / G4
|
5:56
|
Show detailsPlacementPrediction: 0
80% range: 2–5
Top-10 probability: 100 %
Result: 21
Deviation: -21
SwimmingPrognoseabstand: +63 s
Time: 4:12
Pace: 1:33 / 100 m
Ergebnisabstand: +15 s
Fehler: 48.2 s
CyclingPrediction: Group 5 (4 people)
Gruppe 1: 6 %
Speed: 40.2 km/h
Initial Gruppe 6, später eingeholt/vereinigt
Gap ahead:
5.8 s
Gap behind:
0.8 s
Result: Group 4 (5 people)
Speed: 36.8 km/h
Tempo-Fehler: 3.39 km/h
Running and totalRun: ()
Historical basis:
Best comparable pace:
Trend: +0:00 / km
Comparable races: 0
Fallback calculation from other run distances
Ergebnis Lauf: 5:56 (3:29 / km)
Error: /
Overall prediction:
Data basis: 7 Races · Confidence 1.00
Swimming:
4:12
(1:33 / 100 m)
To the end of cycling (group time):
11:35
(40.2 km/h)
Run:
–
Total:
not fully calculable
Target first bike group at the bike finishGoal: finish the bike split with the first bike group.
Estimated requirement:
Swim time: 3:14
Pace: 1:12 / 100 m
About 58.3 s faster in the swim
Maximum predicted gap after the swim: +4.9 s
The complete bike-group simulation, including catches and group mergers, is recalculated through the end of the bike split.
|
|
| 0 / 22 |
 Boris Andreev
BUL
|
+64 s
+12 s
|
G5 / G4
|
6:17
|
Show detailsPlacementPrediction: 0
80% range: 3–5
Top-10 probability: 100 %
Result: 22
Deviation: -22
SwimmingPrognoseabstand: +64 s
Time: 4:13
Pace: 1:34 / 100 m
Ergebnisabstand: +12 s
Fehler: 52.0 s
CyclingPrediction: Group 5 (4 people)
Gruppe 1: 1 %
Speed: 40.2 km/h
Initial Gruppe 6, später eingeholt/vereinigt
Gap ahead:
0.8 s
Gap behind:
22.2 s
Result: Group 4 (5 people)
Speed: 36.7 km/h
Tempo-Fehler: 3.49 km/h
Running and totalRun: ()
Historical basis:
Best comparable pace:
Trend: +0:00 / km
Comparable races: 0
Fallback calculation from other run distances
Ergebnis Lauf: 6:17 (3:42 / km)
Error: /
Overall prediction:
Data basis: 3 Races · Confidence 0.60
Swimming:
4:13
(1:34 / 100 m)
To the end of cycling (group time):
11:35
(40.2 km/h)
Run:
–
Total:
not fully calculable
Target first bike group at the bike finishGoal: finish the bike split with the first bike group.
Estimated requirement:
Swim time: 3:14
Pace: 1:12 / 100 m
About 59 s faster in the swim
Maximum predicted gap after the swim: +5 s
The complete bike-group simulation, including catches and group mergers, is recalculated through the end of the bike split.
|