Prediction comparison
Elite Men
02.11.2025
Viña del Mar
CHI
Race information and calculation basis
2025 Americas Triathlon Cup Vina del Mar
Datengrundlage: maximal zwölf Starts je Athlet:in, die zeitlich strikt vor 02.11.2025 liegen. Neuere Leistungen und direkte Duelle werden mit einer Halbwertszeit von 300 Tagen stärker gewichtet.
Prediction model used
Modell v14
Default values
Prediction quality
67/100
mittel
Show model parameters and data quality
Not yet sufficiently calibrated – conservative defaults are used.
Einzelabstand ≤ 4 s
Gruppenspanne ≤ 14 s
Gruppeneffekt 0.65
Max. Vorteil 2.2 km/h
Datenabdeckung 93.7 % · Head-to-Head-Abdeckung 96.8 % · 0 Kalibrierungsrennen
Retrospective backtest without using the analysed race or later results.
Show methodology
Only after the historical calculation is the prediction compared with the actual result.
Prediction comparison
Summary of prediction errors
Mean place error11.8
Mean swim error22.5 s
Mean bike-speed error4.01 km/h
Correct bike groups23/63
No history0
Within the 80% range63.5 %
| Place Prediction / result |
Athlete | Swimming Prediction / result |
Bike group Prediction / result |
Run Prediction / result |
Overall prediction | Details |
|---|---|---|---|---|---|---|
| 1 / 5 |
 Paul Georgenthum
FRA
|
+18 s
+53 s
|
G3 / G2
|
14:35
14:54
|
40:10 | Show detailsPlacementPrediction: 1
80% range: 2–9
Top-10 probability: 96 %
Result: 5
Deviation: -4
SwimmingPrognoseabstand: +18 s
Time: 9:15
Pace: 1:14 / 100 m
Ergebnisabstand: +53 s
Fehler: -35.5 s
H2H: 13 Gegner:innen,
19 Duelle,
Korrektur 0.32 %,
Sicherheit 31 %
CyclingPrediction: Group 3 (12 people)
Gruppe 1: 29 %
Speed: 44.3 km/h
Initial Gruppe 3, später eingeholt/vereinigt
Gap ahead:
4.4 s
Gap behind:
2.5 s
Result: Group 2 (29 people)
Speed: 41.1 km/h
Tempo-Fehler: 3.18 km/h
Running and totalRun: 14:35 (2:55 / km)
Historical basis: 2:58 / km
Best comparable pace: 2:52 / km
Trend: −0:03 / km
Comparable races: 7
H2H: 10 Gegner:innen,
15 Duelle,
Korrektur 0.49 %,
Sicherheit 23 %
Ergebnis Lauf: 14:54 (2:59 / km)
Error: −0:19 / −0:04 / km
Overall prediction: 40:10
Data basis: 12 Races · Confidence 1.00
Swimming:
9:15
(1:14 / 100 m)
To the end of cycling (group time):
25:04
(44.3 km/h)
Run:
14:35
(2:55 / km)
Total:
40:10
Target first bike group at the bike finishGoal: finish the bike split with the first bike group.
Estimated requirement:
Swim time: 9:06
Pace: 1:13 / 100 m
About 8.6 s faster in the swim
Maximum predicted gap after the swim: +8.9 s
The complete bike-group simulation, including catches and group mergers, is recalculated through the end of the bike split.
|
| 2 / 10 |
 Thomas Hattee
GBR
|
+23 s
+10 s
|
G3 / G1
|
14:47
15:55
|
40:22 | Show detailsPlacementPrediction: 2
80% range: 4–8
Top-10 probability: 98 %
Result: 10
Deviation: -8
SwimmingPrognoseabstand: +23 s
Time: 9:20
Pace: 1:15 / 100 m
Ergebnisabstand: +10 s
Fehler: 13.4 s
H2H: 35 Gegner:innen,
36 Duelle,
Korrektur -0.18 %,
Sicherheit 100 %
CyclingPrediction: Group 3 (12 people)
Gruppe 1: 16 %
Speed: 44.3 km/h
Initial Gruppe 3, später eingeholt/vereinigt
Gap ahead:
1.0 s
Gap behind:
1.4 s
Result: Group 1 (6 people)
Speed: 41.0 km/h
Tempo-Fehler: 3.36 km/h
Running and totalRun: 14:47 (2:57 / km)
Historical basis: 2:56 / km
Best comparable pace: 2:56 / km
Trend: +0:00 / km
Comparable races: 1
H2H: 34 Gegner:innen,
34 Duelle,
Korrektur 0.88 %,
Sicherheit 100 %
Ergebnis Lauf: 15:55 (3:11 / km)
Error: −1:08 / −0:14 / km
Overall prediction: 40:22
Data basis: 8 Races · Confidence 1.00
Swimming:
9:20
(1:15 / 100 m)
To the end of cycling (group time):
25:04
(44.3 km/h)
Run:
14:47
(2:57 / km)
Total:
40:22
Target first bike group at the bike finishGoal: finish the bike split with the first bike group.
Estimated requirement:
Swim time: 9:10
Pace: 1:13 / 100 m
About 10 s faster in the swim
Maximum predicted gap after the swim: +13.4 s
The complete bike-group simulation, including catches and group mergers, is recalculated through the end of the bike split.
|
| 3 / 3 |
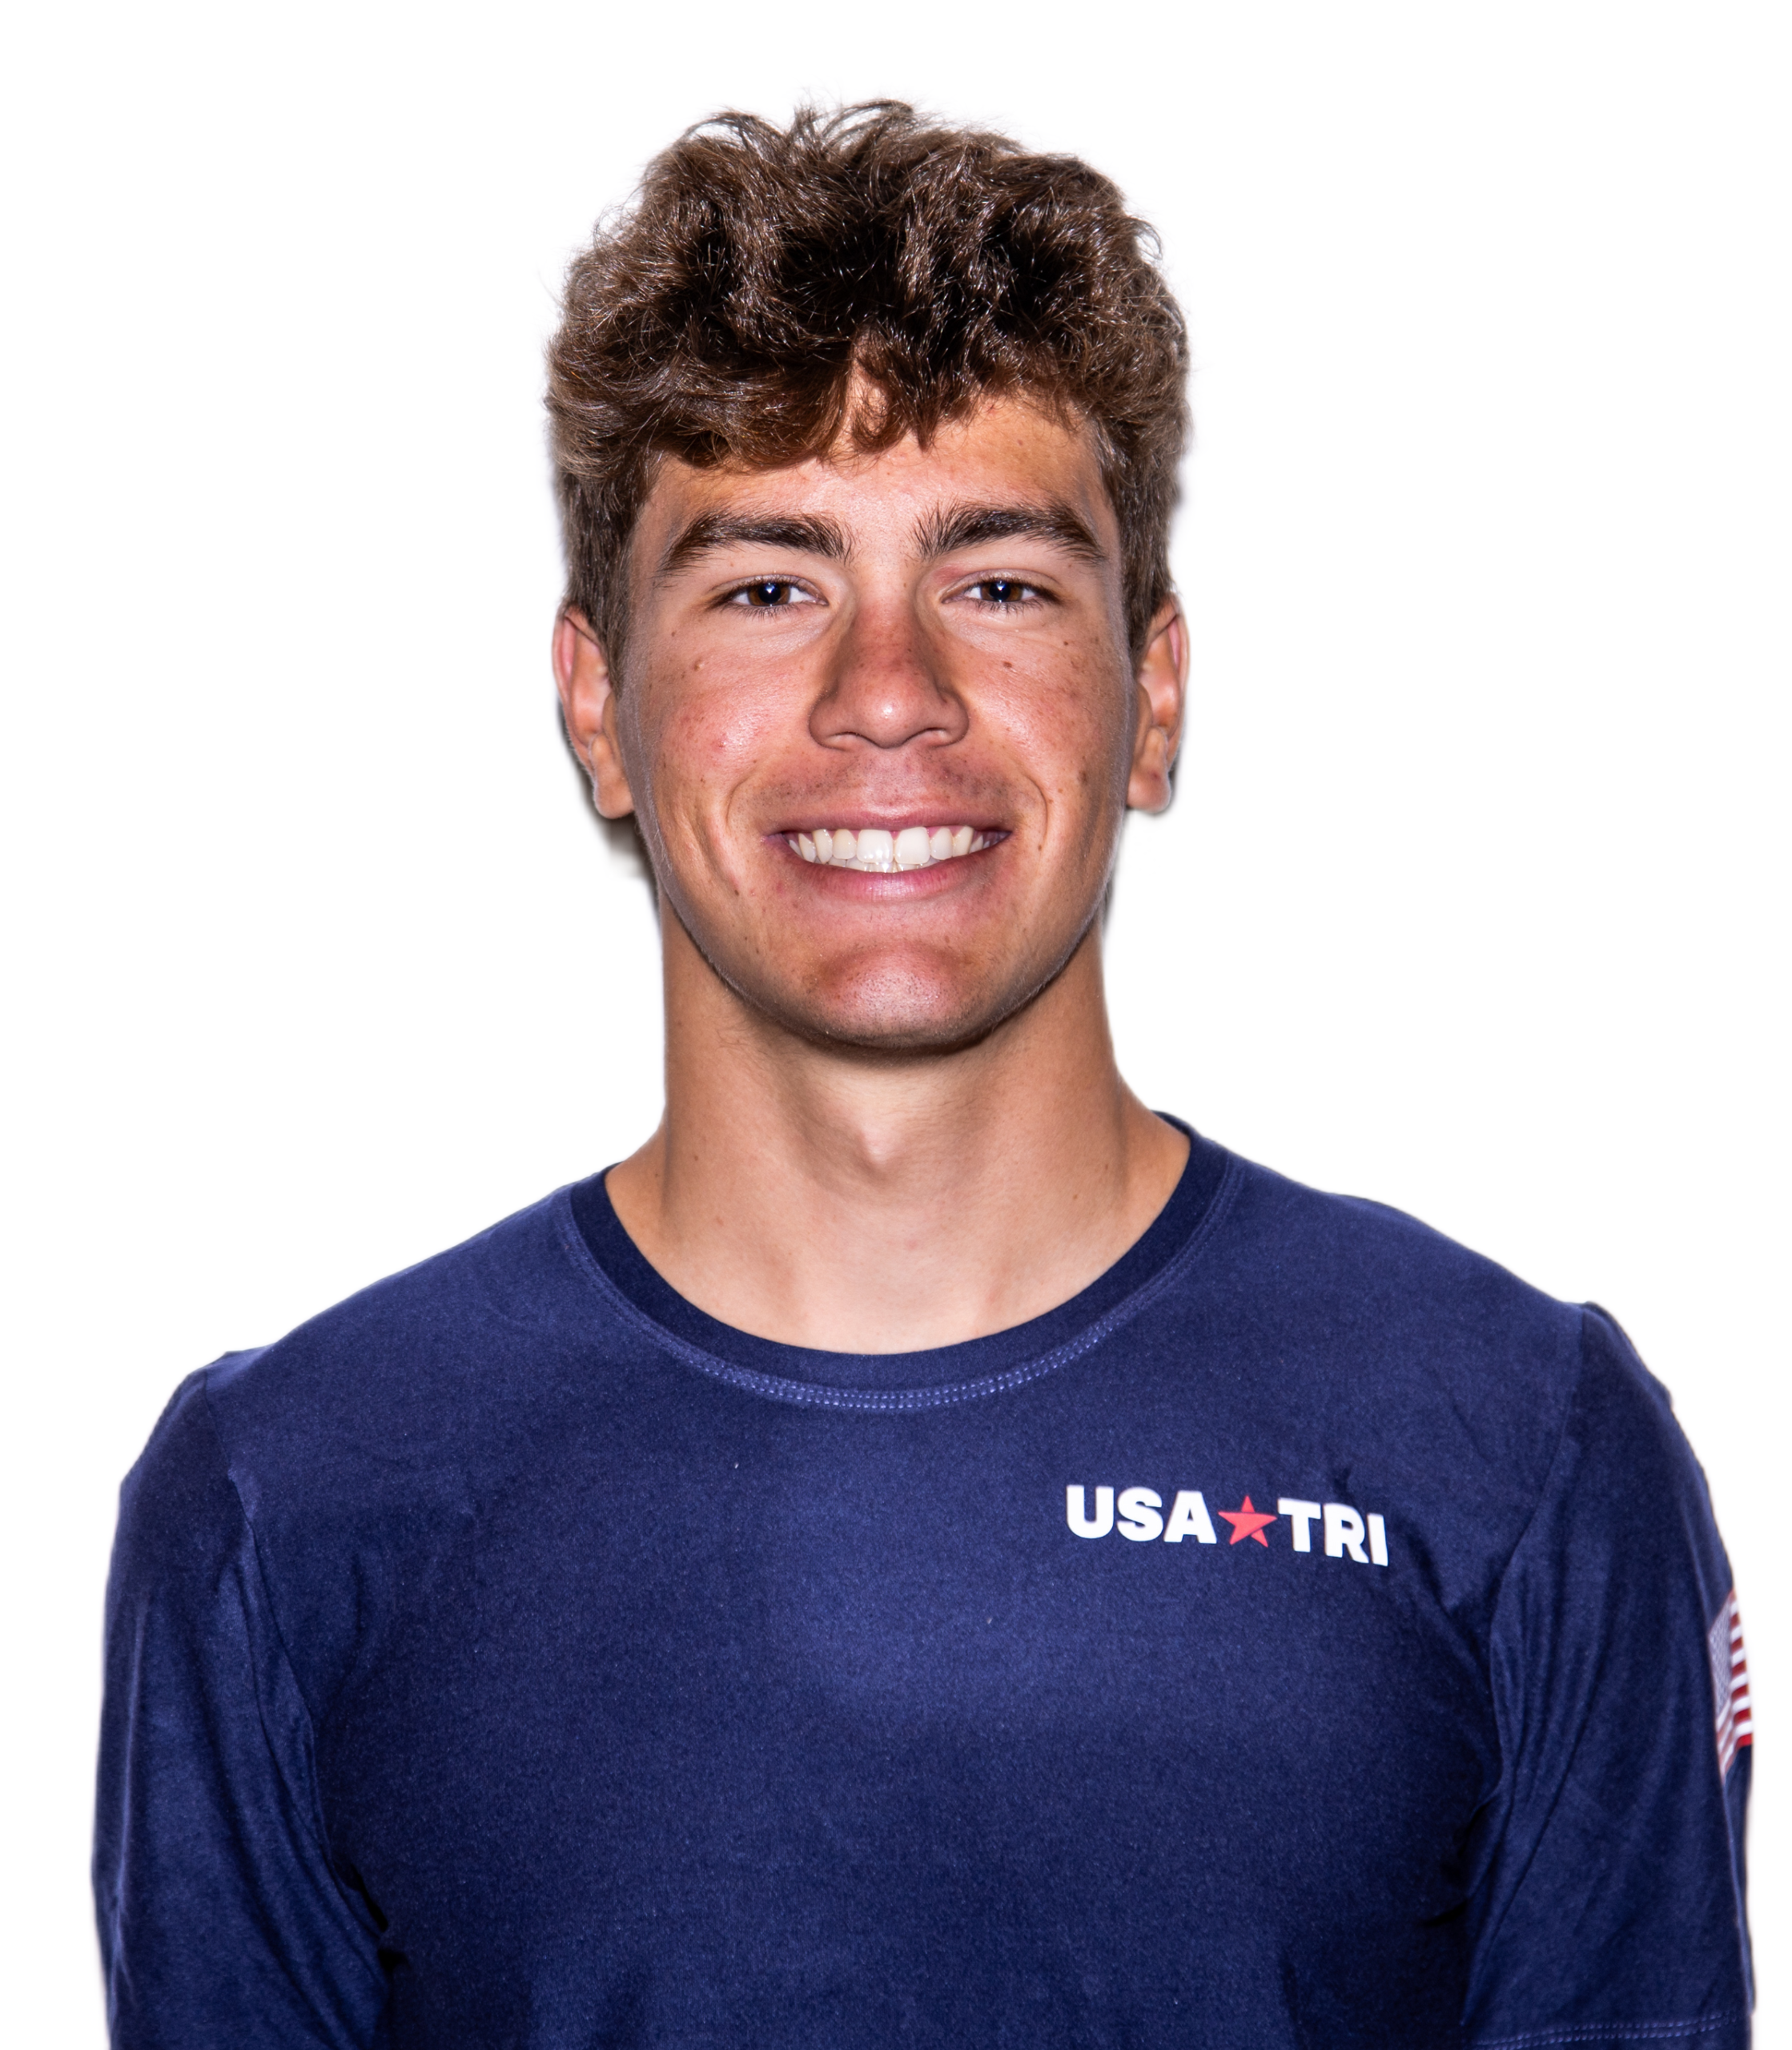 Blake Bullard
USA
|
+40 s
+13 s
|
G2 / G1
|
14:58
15:21
|
40:32 | Show detailsPlacementPrediction: 3
80% range: 3–32
Top-10 probability: 45 %
Result: 3
Deviation: 0
SwimmingPrognoseabstand: +40 s
Time: 9:37
Pace: 1:17 / 100 m
Ergebnisabstand: +13 s
Fehler: 27.0 s
H2H: 52 Gegner:innen,
117 Duelle,
Korrektur -0.72 %,
Sicherheit 100 %
CyclingPrediction: Group 2 (23 people)
Gruppe 1: 0 %
Speed: 44.8 km/h
Initial Gruppe 4, später eingeholt/vereinigt
Gap ahead:
0.1 s
Gap behind:
0.5 s
Result: Group 1 (6 people)
Speed: 40.9 km/h
Tempo-Fehler: 3.84 km/h
Running and totalRun: 14:58 (3:00 / km)
Historical basis: 3:03 / km
Best comparable pace: 2:44 / km
Trend: −0:03 / km
Comparable races: 8
H2H: 52 Gegner:innen,
118 Duelle,
Korrektur -0.23 %,
Sicherheit 100 %
Ergebnis Lauf: 15:21 (3:04 / km)
Error: −0:23 / −0:05 / km
Overall prediction: 40:32
Data basis: 12 Races · Confidence 1.00
Swimming:
9:37
(1:17 / 100 m)
To the end of cycling (group time):
24:47
(44.8 km/h)
Run:
14:58
(3:00 / km)
Total:
40:32
Target first bike group at the bike finishGoal: finish the bike split with the first bike group.
Estimated requirement:
Swim time: 9:06
Pace: 1:13 / 100 m
About 31.1 s faster in the swim
Maximum predicted gap after the swim: +8.9 s
The complete bike-group simulation, including catches and group mergers, is recalculated through the end of the bike split.
|
| 4 / 1 |
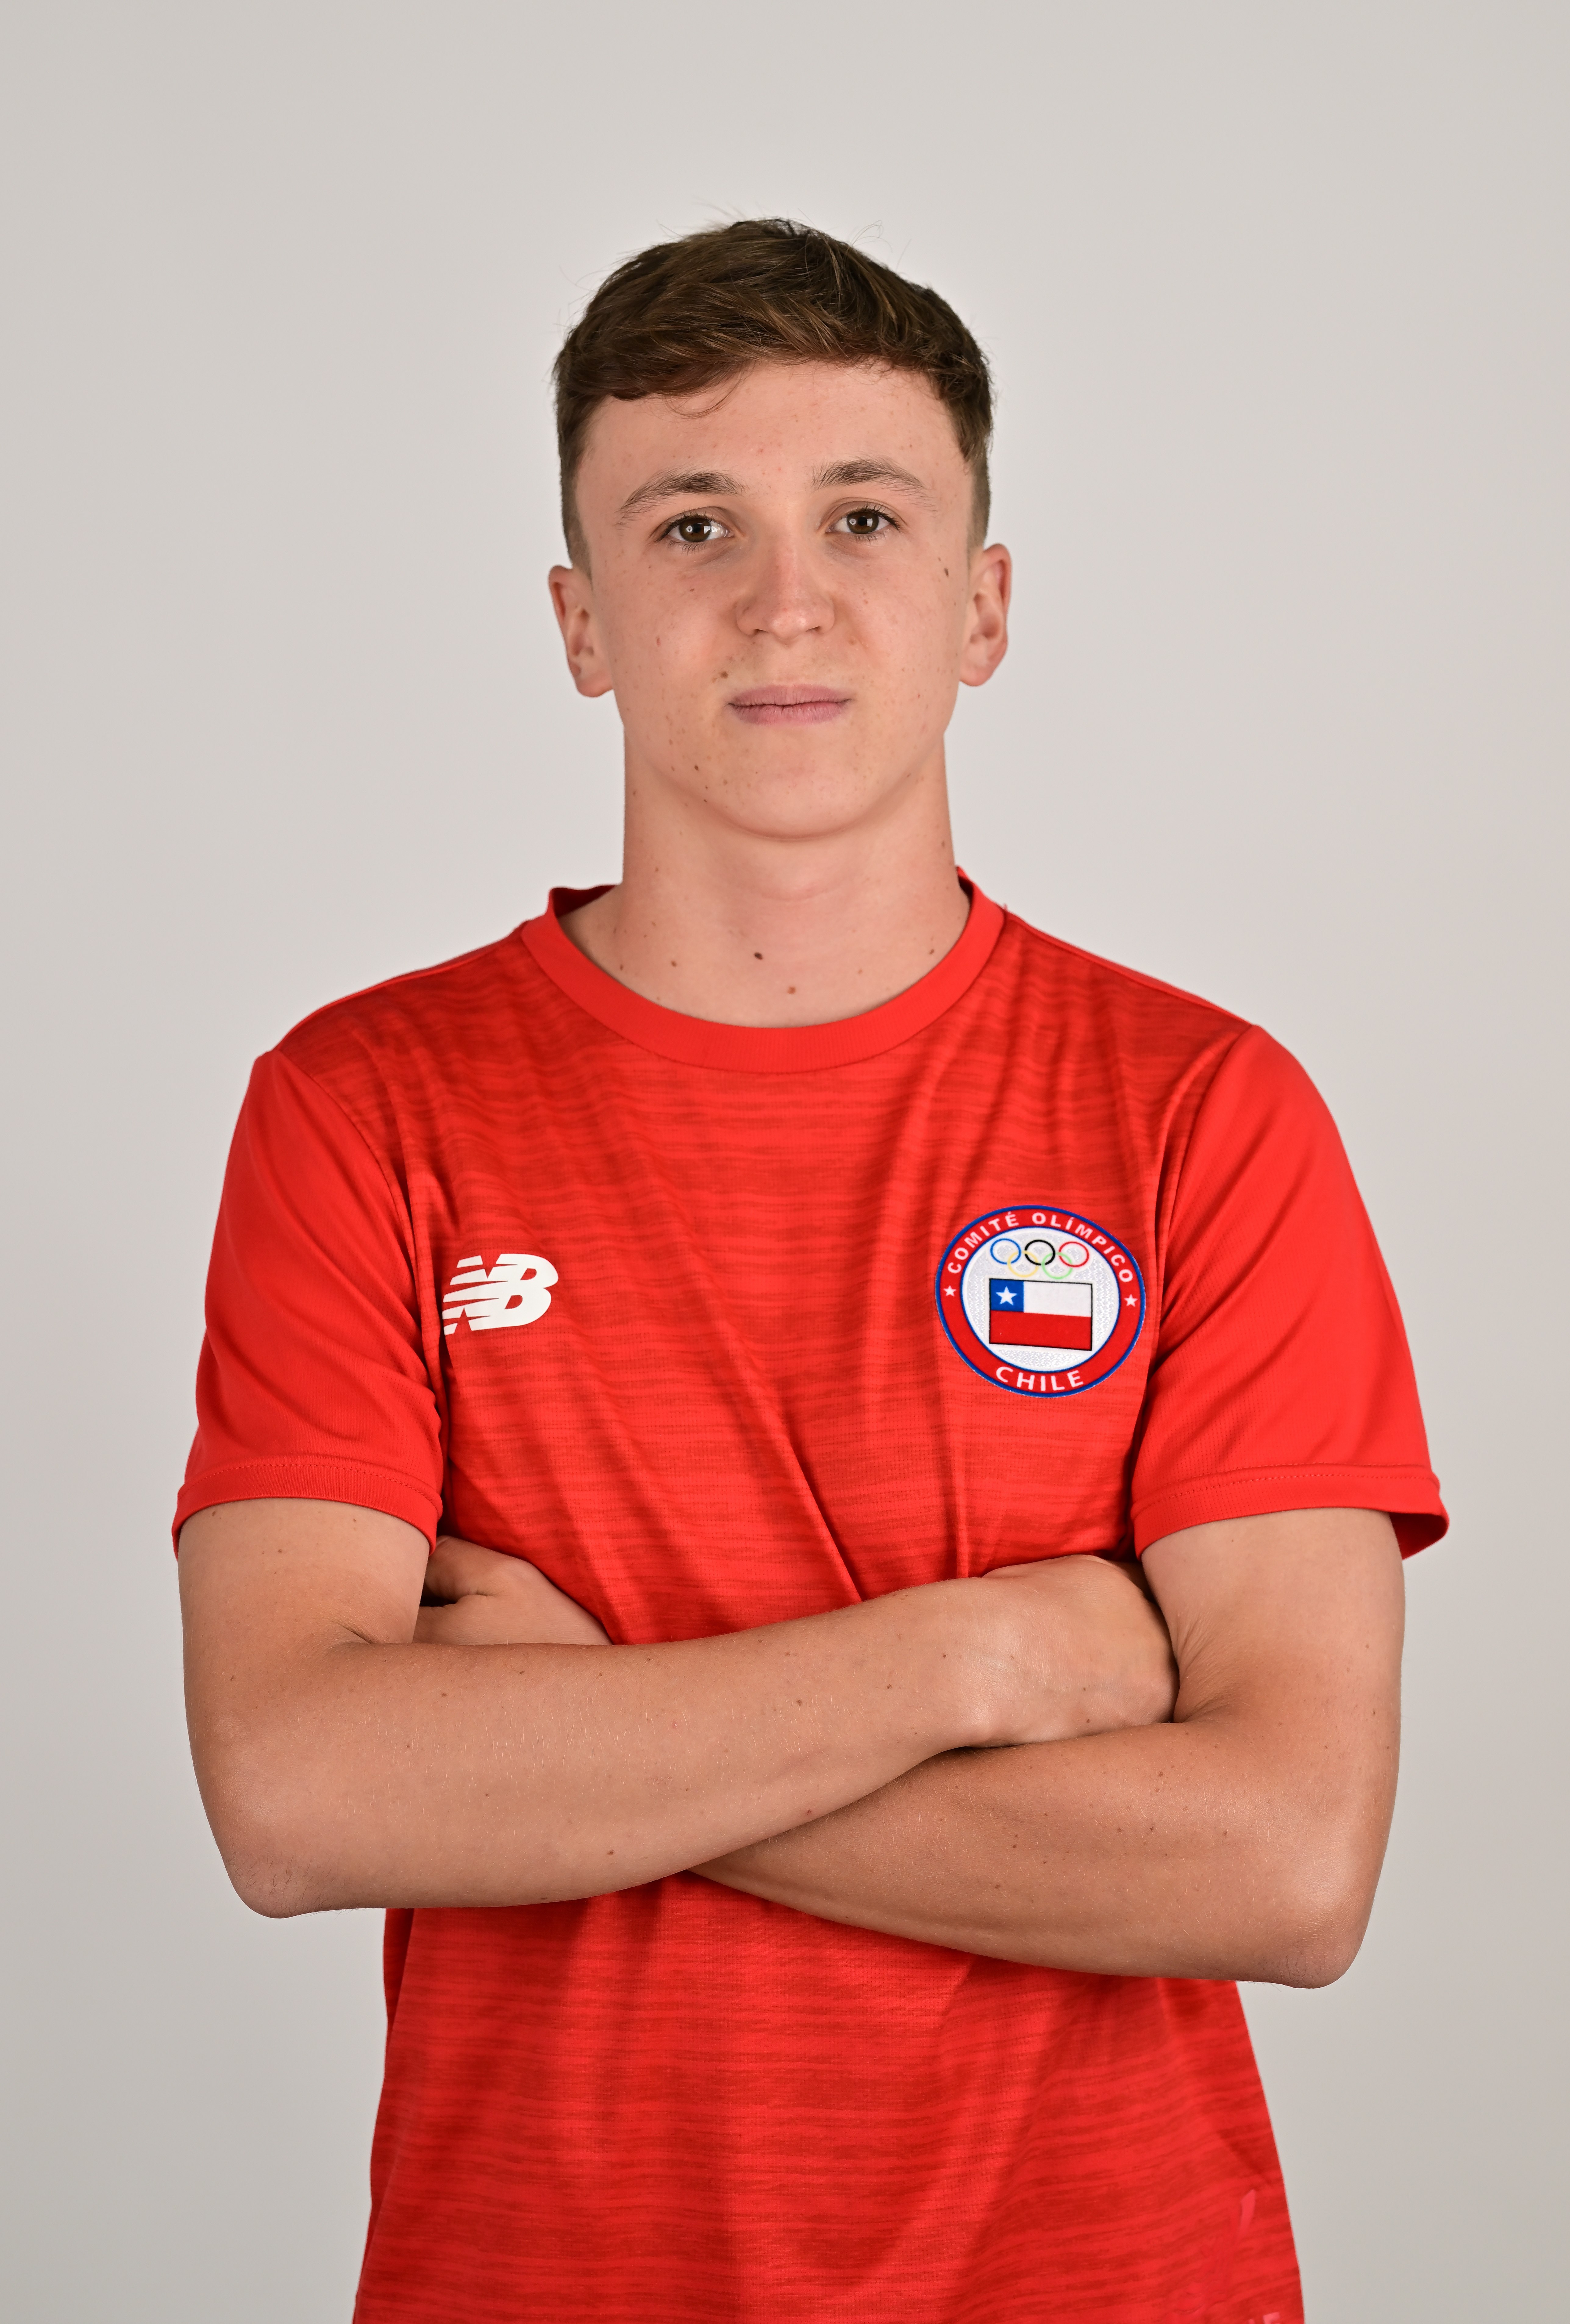 Andres Gras
CHI
|
+25 s
+22 s
|
G3 / G1
|
15:22
15:04
|
40:57 | Show detailsPlacementPrediction: 4
80% range: 4–22
Top-10 probability: 53 %
Result: 1
Deviation: 3
SwimmingPrognoseabstand: +25 s
Time: 9:22
Pace: 1:15 / 100 m
Ergebnisabstand: +22 s
Fehler: 2.8 s
H2H: 31 Gegner:innen,
63 Duelle,
Korrektur 1.25 %,
Sicherheit 92 %
CyclingPrediction: Group 3 (12 people)
Gruppe 1: 13 %
Speed: 44.3 km/h
Initial Gruppe 3, später eingeholt/vereinigt
Gap ahead:
1.4 s
Gap behind:
1.6 s
Result: Group 1 (6 people)
Speed: 41.3 km/h
Tempo-Fehler: 3.06 km/h
Running and totalRun: 15:22 (3:04 / km)
Historical basis: 3:08 / km
Best comparable pace: 3:01 / km
Trend: −0:04 / km
Comparable races: 6
H2H: 29 Gegner:innen,
57 Duelle,
Korrektur -0.02 %,
Sicherheit 73 %
Ergebnis Lauf: 15:04 (3:01 / km)
Error: +0:18 / +0:04 / km
Overall prediction: 40:57
Data basis: 12 Races · Confidence 1.00
Swimming:
9:22
(1:15 / 100 m)
To the end of cycling (group time):
25:04
(44.3 km/h)
Run:
15:22
(3:04 / km)
Total:
40:57
Target first bike group at the bike finishGoal: finish the bike split with the first bike group.
Estimated requirement:
Swim time: 9:06
Pace: 1:13 / 100 m
About 15.9 s faster in the swim
Maximum predicted gap after the swim: +8.9 s
The complete bike-group simulation, including catches and group mergers, is recalculated through the end of the bike split.
|
| 5 / 6 |
 Guillaume Hay
FRA
|
+26 s
+79 s
|
G3 / G2
|
15:26
14:56
|
41:01 | Show detailsPlacementPrediction: 5
80% range: 6–19
Top-10 probability: 55 %
Result: 6
Deviation: -1
SwimmingPrognoseabstand: +26 s
Time: 9:23
Pace: 1:15 / 100 m
Ergebnisabstand: +79 s
Fehler: -52.6 s
H2H: 15 Gegner:innen,
20 Duelle,
Korrektur 0.77 %,
Sicherheit 76 %
CyclingPrediction: Group 3 (12 people)
Gruppe 1: 28 %
Speed: 44.3 km/h
Initial Gruppe 3, später eingeholt/vereinigt
Gap ahead:
1.6 s
Gap behind:
2.1 s
Result: Group 2 (29 people)
Speed: 42.0 km/h
Tempo-Fehler: 2.30 km/h
Running and totalRun: 15:26 (3:05 / km)
Historical basis: 3:06 / km
Best comparable pace: 2:49 / km
Trend: +0:00 / km
Comparable races: 7
H2H: 16 Gegner:innen,
21 Duelle,
Korrektur -0.17 %,
Sicherheit 75 %
Ergebnis Lauf: 14:56 (2:59 / km)
Error: +0:30 / +0:06 / km
Overall prediction: 41:01
Data basis: 12 Races · Confidence 1.00
Swimming:
9:23
(1:15 / 100 m)
To the end of cycling (group time):
25:04
(44.3 km/h)
Run:
15:26
(3:05 / km)
Total:
41:01
Target first bike group at the bike finishGoal: finish the bike split with the first bike group.
Estimated requirement:
Swim time: 9:10
Pace: 1:13 / 100 m
About 13 s faster in the swim
Maximum predicted gap after the swim: +13.4 s
The complete bike-group simulation, including catches and group mergers, is recalculated through the end of the bike split.
|
| 6 / 11 |
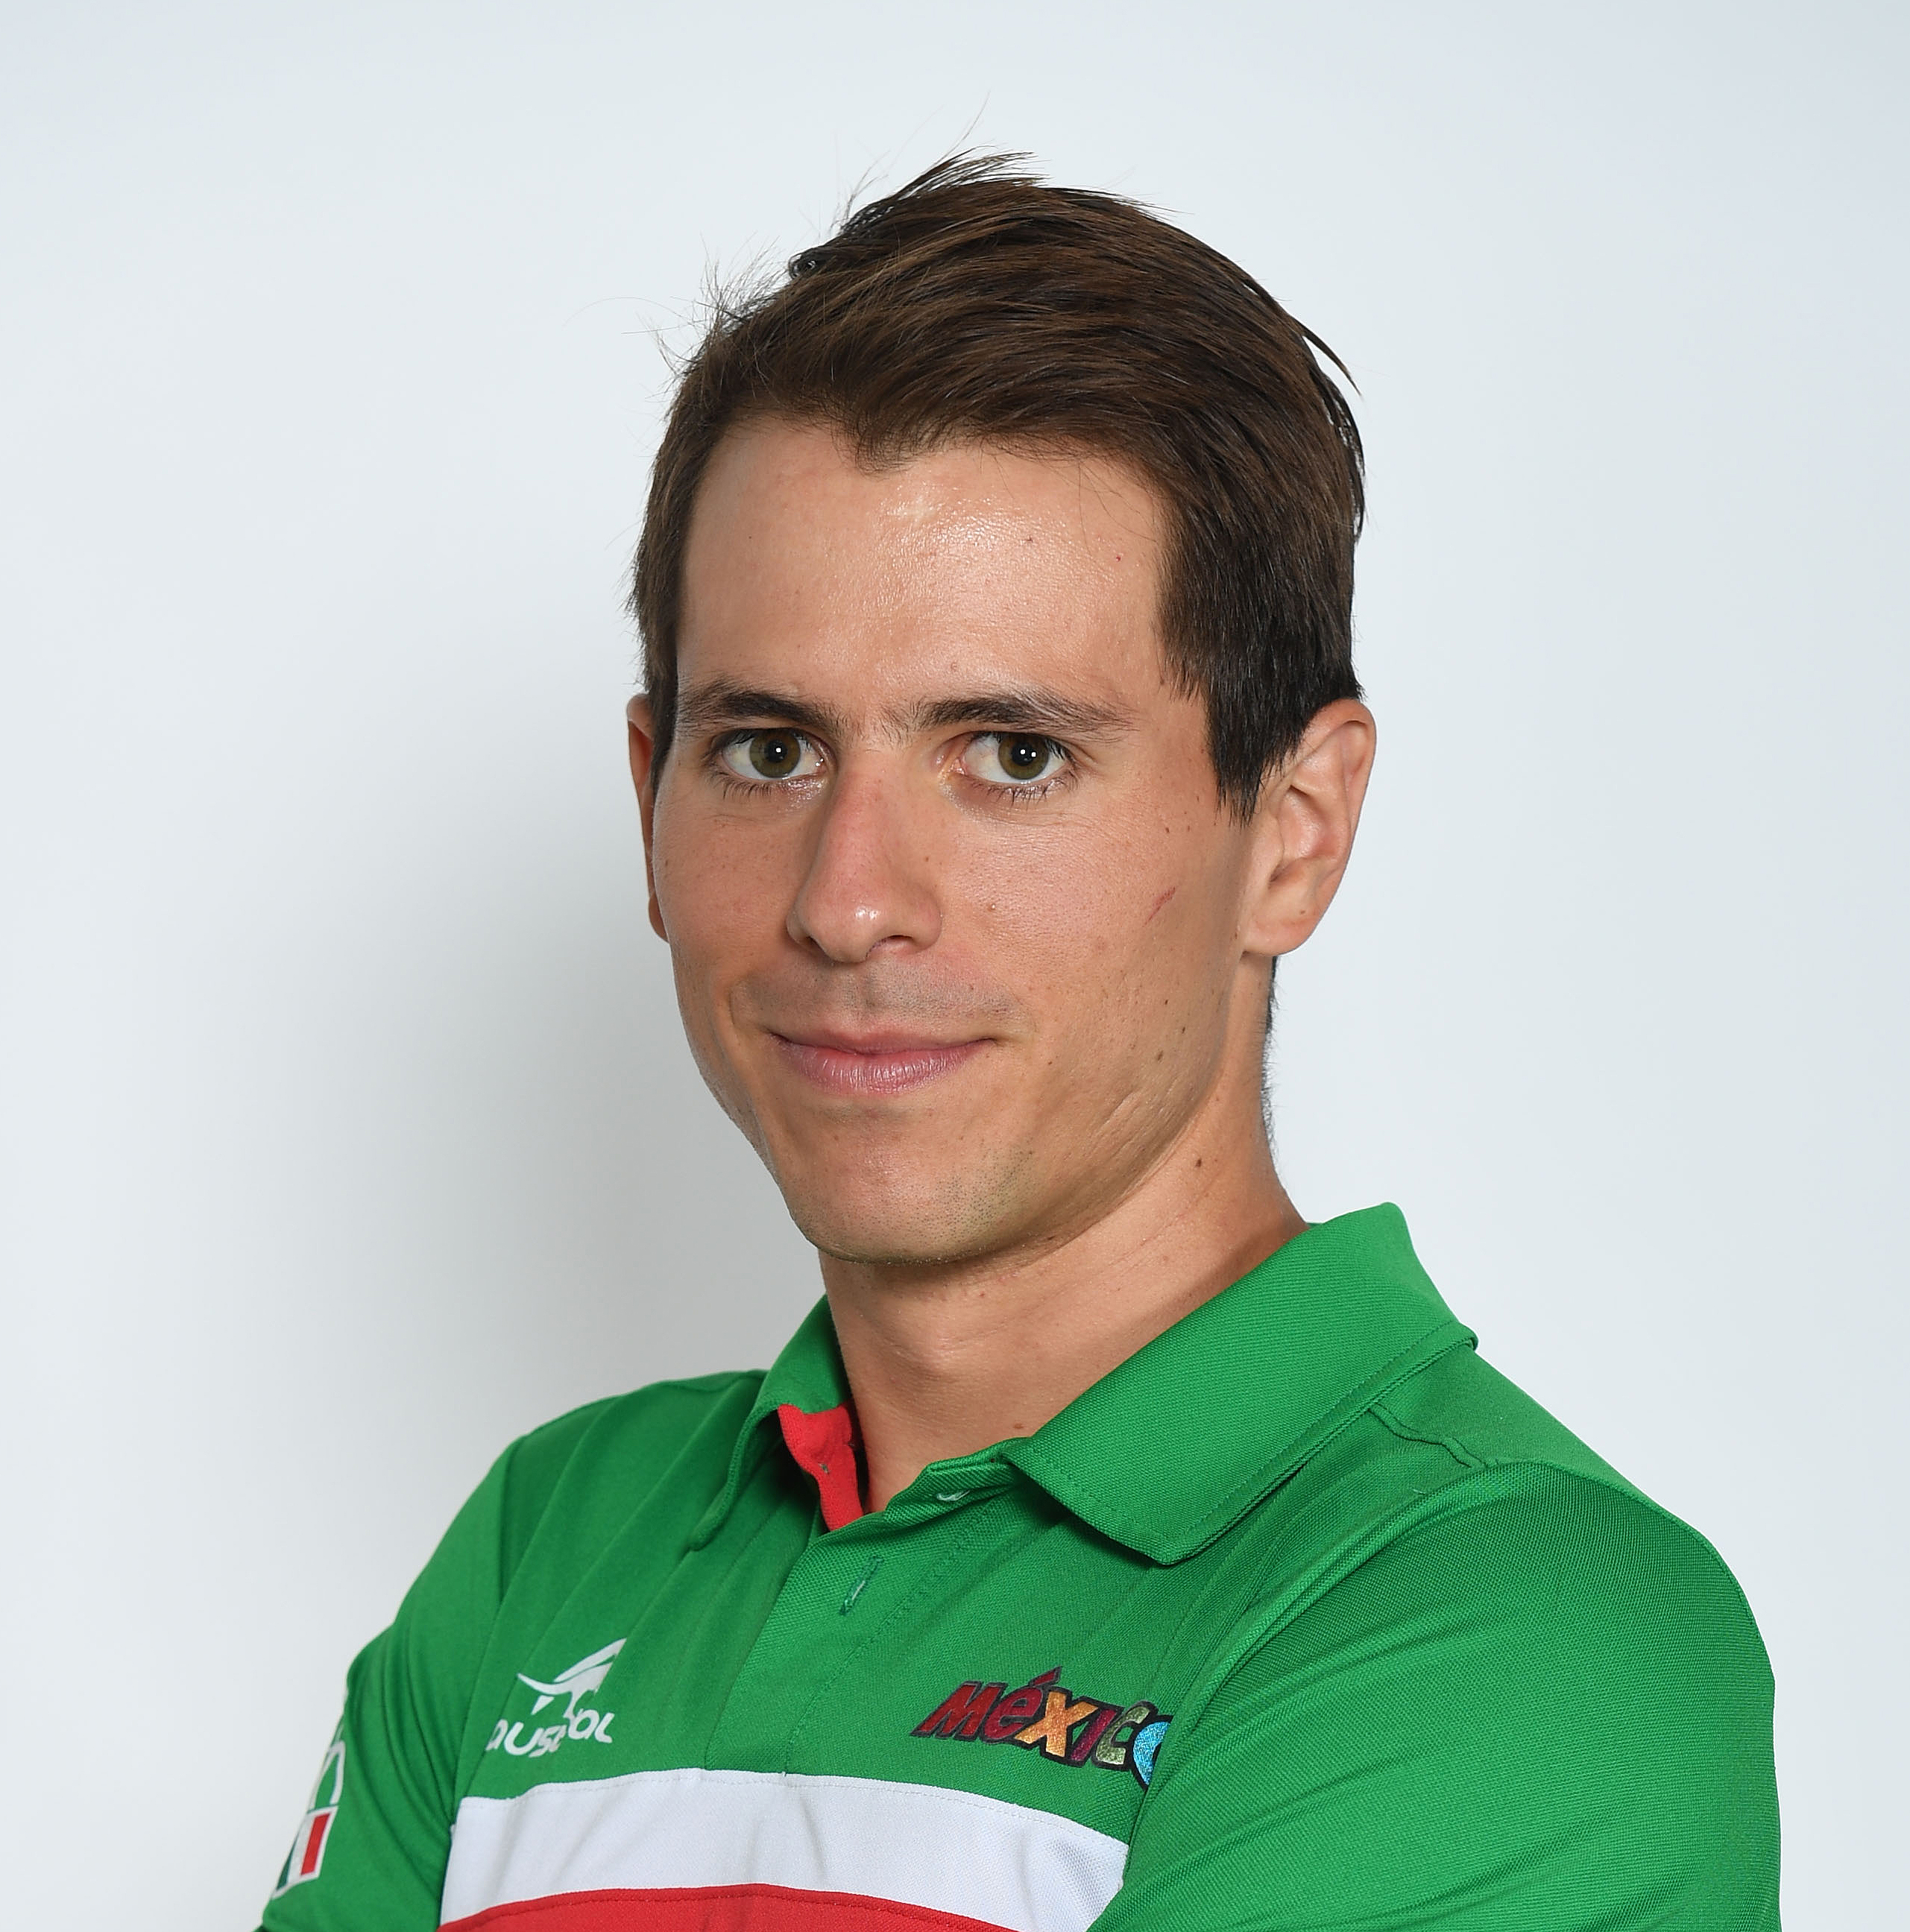 Rodrigo Gonzalez Lopez
MEX
|
+52 s
+55 s
|
G4 / G2
|
15:03
15:27
|
41:04 | Show detailsPlacementPrediction: 6
80% range: 5–30
Top-10 probability: 29 %
Result: 11
Deviation: -5
SwimmingPrognoseabstand: +52 s
Time: 9:49
Pace: 1:19 / 100 m
Ergebnisabstand: +55 s
Fehler: -2.8 s
H2H: 49 Gegner:innen,
144 Duelle,
Korrektur -0.34 %,
Sicherheit 100 %
CyclingPrediction: Group 4 (15 people)
Gruppe 1: 0 %
Speed: 44.4 km/h
Initial Gruppe 5, später eingeholt/vereinigt
Gap ahead:
0.2 s
Gap behind:
3.9 s
Result: Group 2 (29 people)
Speed: 41.0 km/h
Tempo-Fehler: 3.36 km/h
Running and totalRun: 15:03 (3:01 / km)
Historical basis: 3:01 / km
Best comparable pace: 2:47 / km
Trend: +0:00 / km
Comparable races: 7
H2H: 48 Gegner:innen,
138 Duelle,
Korrektur -0.16 %,
Sicherheit 100 %
Ergebnis Lauf: 15:27 (3:05 / km)
Error: −0:24 / −0:05 / km
Overall prediction: 41:04
Data basis: 12 Races · Confidence 1.00
Swimming:
9:49
(1:19 / 100 m)
To the end of cycling (group time):
25:01
(44.4 km/h)
Run:
15:03
(3:01 / km)
Total:
41:04
Target first bike group at the bike finishGoal: finish the bike split with the first bike group.
Estimated requirement:
Swim time: 9:28
Pace: 1:16 / 100 m
About 20.8 s faster in the swim
Maximum predicted gap after the swim: +31.4 s
The complete bike-group simulation, including catches and group mergers, is recalculated through the end of the bike split.
|
| 7 / 43 |
Nicholas Andres Miller Herrera
CHI
|
+39 s
+92 s
|
G2 / G4
|
15:33
16:56
|
41:07 | Show detailsPlacementPrediction: 7
80% range: 12–22
Top-10 probability: 5 %
Result: 43
Deviation: -36
SwimmingPrognoseabstand: +39 s
Time: 9:36
Pace: 1:17 / 100 m
Ergebnisabstand: +92 s
Fehler: -52.6 s
H2H: 23 Gegner:innen,
29 Duelle,
Korrektur 0.32 %,
Sicherheit 98 %
CyclingPrediction: Group 2 (23 people)
Gruppe 1: 1 %
Speed: 44.8 km/h
Initial Gruppe 4, später eingeholt/vereinigt
Gap ahead:
0.3 s
Gap behind:
0.5 s
Result: Group 4 (12 people)
Speed: 38.9 km/h
Tempo-Fehler: 5.88 km/h
Running and totalRun: 15:33 (3:07 / km)
Historical basis: 3:02 / km
Best comparable pace: 3:02 / km
Trend: +0:00 / km
Comparable races: 3
H2H: 23 Gegner:innen,
29 Duelle,
Korrektur 2.53 %,
Sicherheit 81 %
Ergebnis Lauf: 16:56 (3:23 / km)
Error: −1:23 / −0:17 / km
Overall prediction: 41:07
Data basis: 5 Races · Confidence 1.00
Swimming:
9:36
(1:17 / 100 m)
To the end of cycling (group time):
24:47
(44.8 km/h)
Run:
15:33
(3:07 / km)
Total:
41:07
Target first bike group at the bike finishGoal: finish the bike split with the first bike group.
Estimated requirement:
Swim time: 9:06
Pace: 1:13 / 100 m
About 30.5 s faster in the swim
Maximum predicted gap after the swim: +8.9 s
The complete bike-group simulation, including catches and group mergers, is recalculated through the end of the bike split.
|
| 8 / 27 |
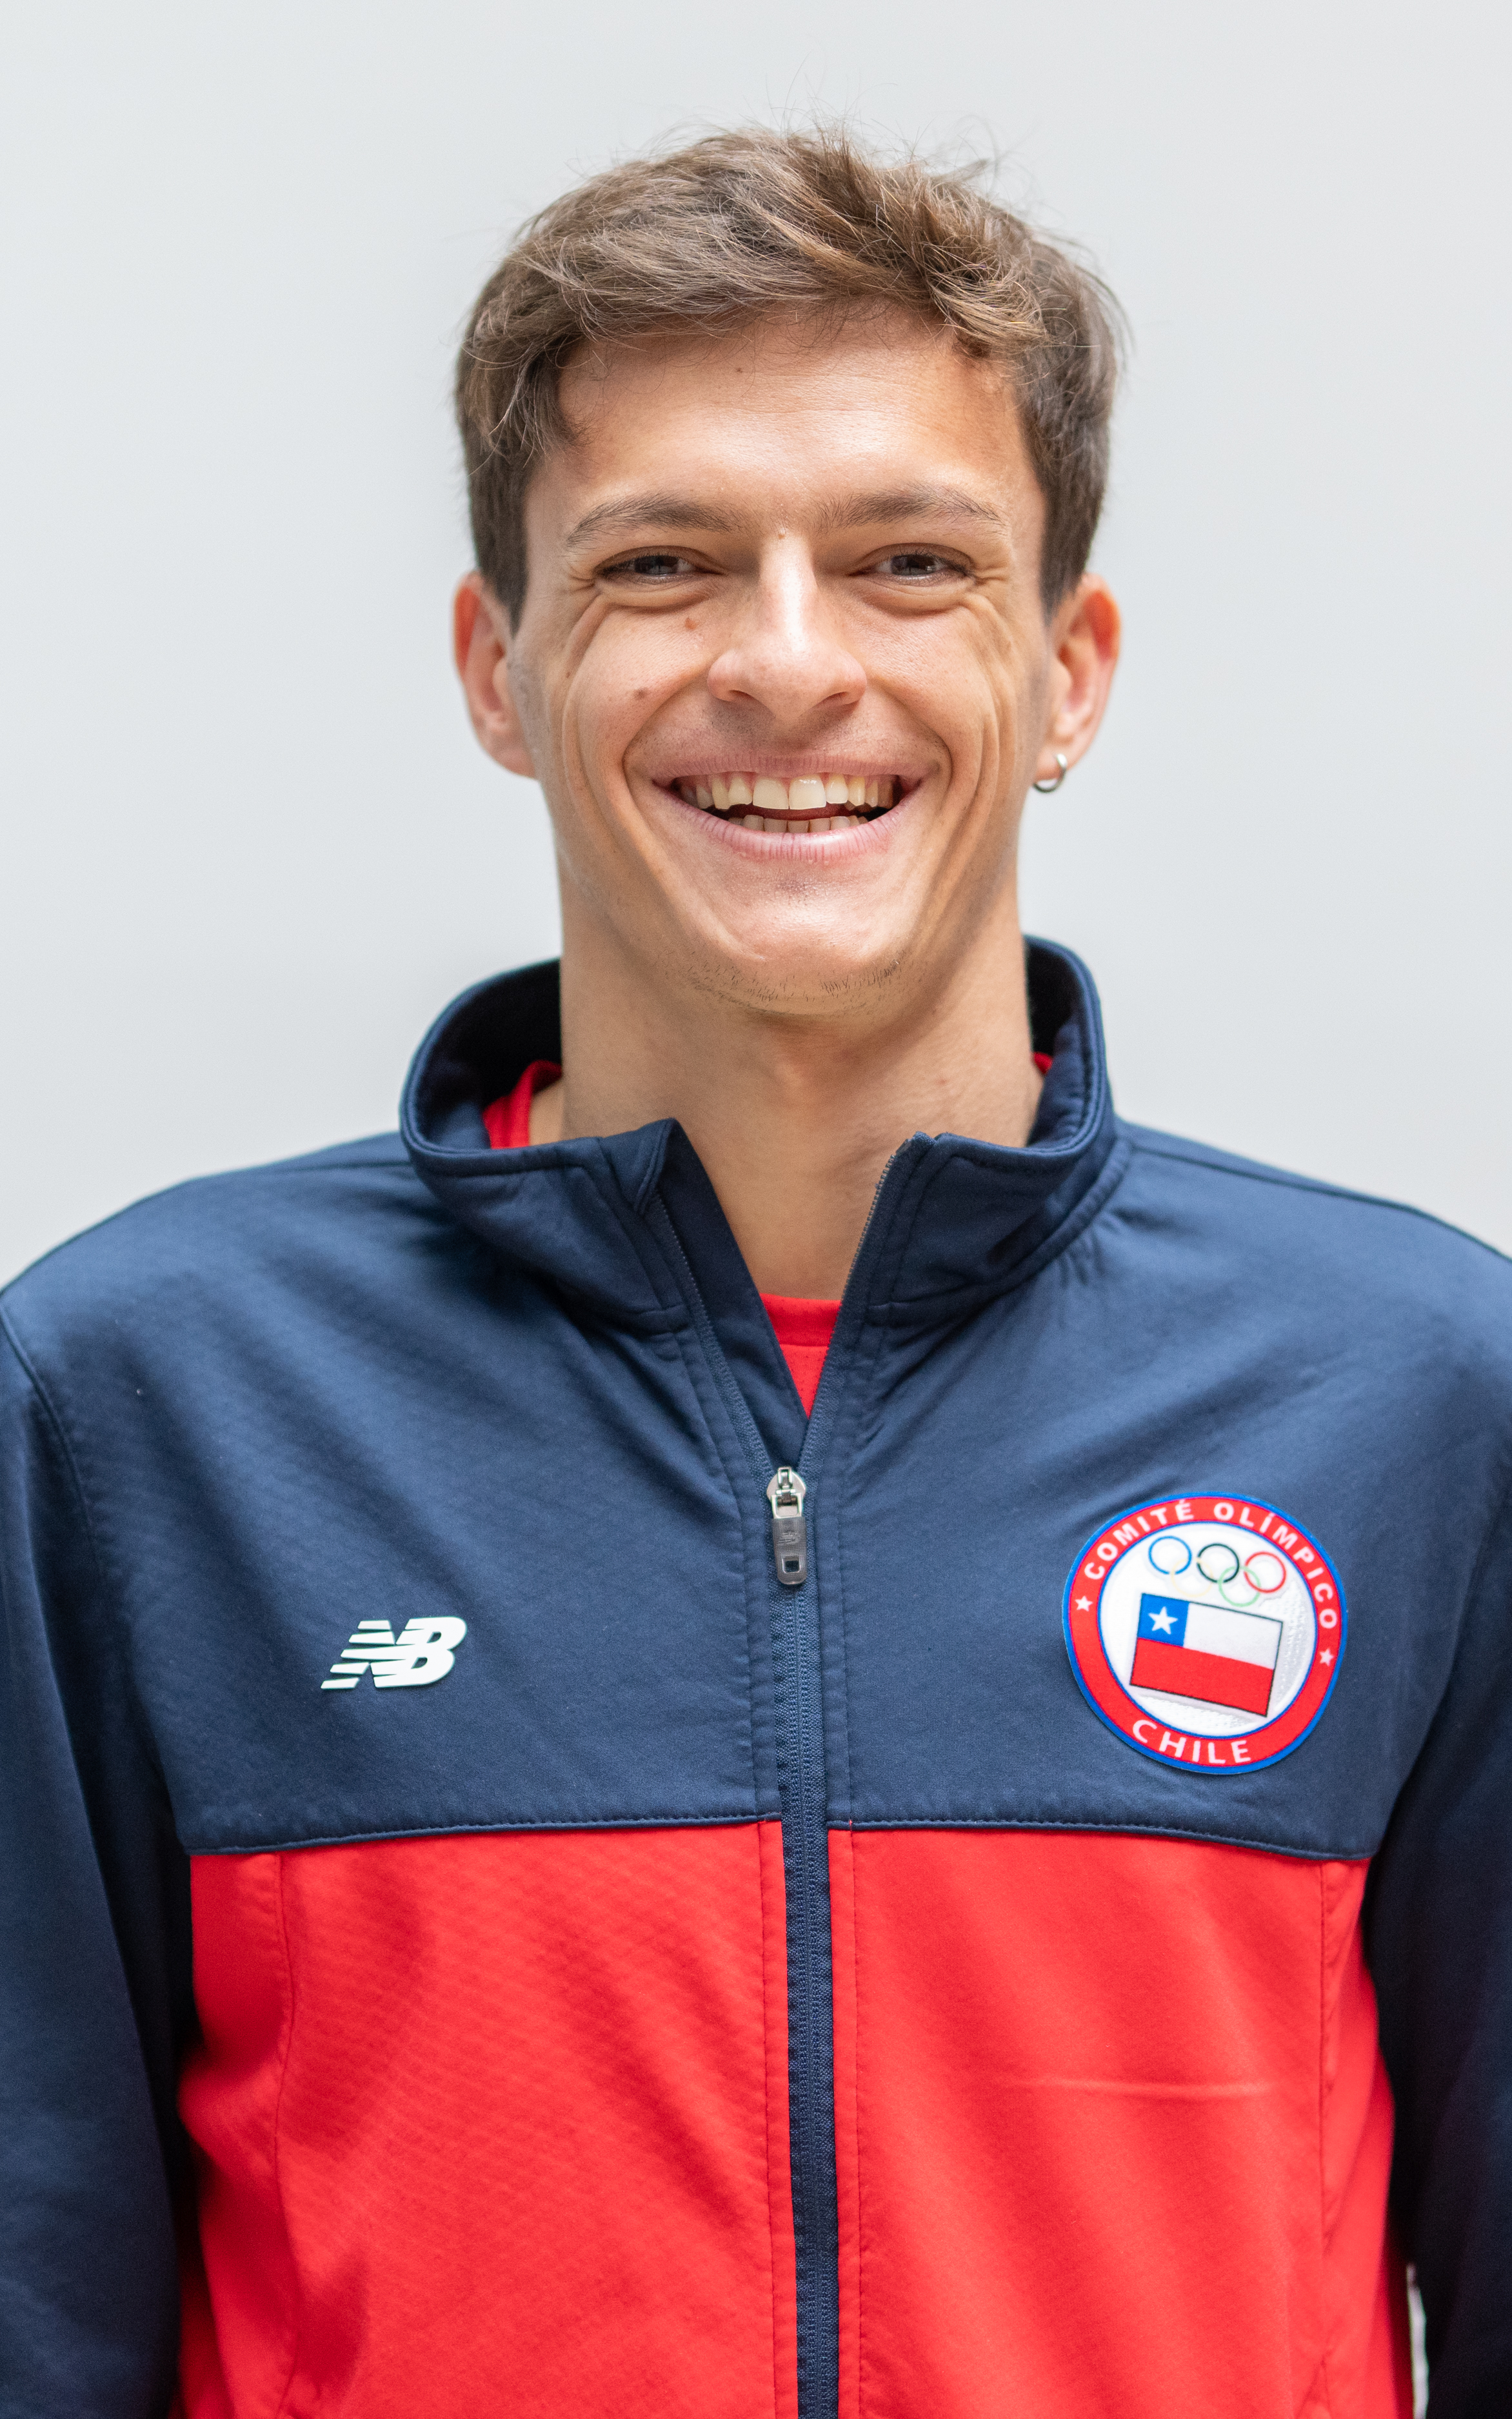 Mateo Mendoza Burgos
CHI
|
+39 s
+58 s
|
G2 / G2
correct
|
15:35
16:20
|
41:09 | Show detailsPlacementPrediction: 8
80% range: 6–36
Top-10 probability: 30 %
Result: 27
Deviation: -19
SwimmingPrognoseabstand: +39 s
Time: 9:36
Pace: 1:17 / 100 m
Ergebnisabstand: +58 s
Fehler: -19.3 s
H2H: 48 Gegner:innen,
195 Duelle,
Korrektur 0.00 %,
Sicherheit 100 %
CyclingPrediction: Group 2 (23 people)
Gruppe 1: 9 %
Speed: 44.8 km/h
Initial Gruppe 4, später eingeholt/vereinigt
Gap ahead:
1.8 s
Gap behind:
0.4 s
Result: Group 2 (29 people)
Speed: 41.3 km/h
Tempo-Fehler: 3.46 km/h
Running and totalRun: 15:35 (3:07 / km)
Historical basis: 3:11 / km
Best comparable pace: 2:50 / km
Trend: −0:03 / km
Comparable races: 5
H2H: 47 Gegner:innen,
188 Duelle,
Korrektur -0.44 %,
Sicherheit 100 %
Ergebnis Lauf: 16:20 (3:16 / km)
Error: −0:45 / −0:09 / km
Overall prediction: 41:09
Data basis: 12 Races · Confidence 1.00
Swimming:
9:36
(1:17 / 100 m)
To the end of cycling (group time):
24:47
(44.8 km/h)
Run:
15:35
(3:07 / km)
Total:
41:09
Target first bike group at the bike finishGoal: finish the bike split with the first bike group.
Estimated requirement:
Swim time: 9:29
Pace: 1:16 / 100 m
About 7.3 s faster in the swim
Maximum predicted gap after the swim: +31.4 s
The complete bike-group simulation, including catches and group mergers, is recalculated through the end of the bike split.
|
| 9 / 23 |
 Hugo Mario Ruiz Dimate
COL
|
+34 s
+80 s
|
G2 / G2
correct
|
15:37
16:03
|
41:11 | Show detailsPlacementPrediction: 9
80% range: 9–28
Top-10 probability: 18 %
Result: 23
Deviation: -14
SwimmingPrognoseabstand: +34 s
Time: 9:31
Pace: 1:16 / 100 m
Ergebnisabstand: +80 s
Fehler: -46.4 s
H2H: 39 Gegner:innen,
138 Duelle,
Korrektur 0.84 %,
Sicherheit 100 %
CyclingPrediction: Group 2 (23 people)
Gruppe 1: 3 %
Speed: 44.8 km/h
Initial Gruppe 4, später eingeholt/vereinigt
Gap ahead:
1.2 s
Gap behind:
1.2 s
Result: Group 2 (29 people)
Speed: 41.6 km/h
Tempo-Fehler: 3.15 km/h
Running and totalRun: 15:37 (3:07 / km)
Historical basis: 3:11 / km
Best comparable pace: 3:04 / km
Trend: −0:02 / km
Comparable races: 8
H2H: 37 Gegner:innen,
122 Duelle,
Korrektur -0.55 %,
Sicherheit 100 %
Ergebnis Lauf: 16:03 (3:13 / km)
Error: −0:26 / −0:05 / km
Overall prediction: 41:11
Data basis: 12 Races · Confidence 1.00
Swimming:
9:31
(1:16 / 100 m)
To the end of cycling (group time):
24:47
(44.8 km/h)
Run:
15:37
(3:07 / km)
Total:
41:11
Target first bike group at the bike finishGoal: finish the bike split with the first bike group.
Estimated requirement:
Swim time: 9:06
Pace: 1:13 / 100 m
About 24.7 s faster in the swim
Maximum predicted gap after the swim: +8.9 s
The complete bike-group simulation, including catches and group mergers, is recalculated through the end of the bike split.
|
| 10 / 19 |
 Fernando Jacome
CHI
|
+29 s
+59 s
|
G3 / G2
|
15:37
15:52
|
41:12 | Show detailsPlacementPrediction: 10
80% range: 6–31
Top-10 probability: 36 %
Result: 19
Deviation: -9
SwimmingPrognoseabstand: +29 s
Time: 9:26
Pace: 1:15 / 100 m
Ergebnisabstand: +59 s
Fehler: -30.5 s
H2H: 48 Gegner:innen,
197 Duelle,
Korrektur 0.09 %,
Sicherheit 100 %
CyclingPrediction: Group 3 (12 people)
Gruppe 1: 13 %
Speed: 44.3 km/h
Initial Gruppe 3, später eingeholt/vereinigt
Gap ahead:
2.1 s
Gap behind:
0.9 s
Result: Group 2 (29 people)
Speed: 41.2 km/h
Tempo-Fehler: 3.11 km/h
Running and totalRun: 15:37 (3:07 / km)
Historical basis: 3:08 / km
Best comparable pace: 2:55 / km
Trend: +0:00 / km
Comparable races: 5
H2H: 47 Gegner:innen,
191 Duelle,
Korrektur -0.09 %,
Sicherheit 100 %
Ergebnis Lauf: 15:52 (3:10 / km)
Error: −0:15 / −0:03 / km
Overall prediction: 41:12
Data basis: 12 Races · Confidence 1.00
Swimming:
9:26
(1:15 / 100 m)
To the end of cycling (group time):
25:04
(44.3 km/h)
Run:
15:37
(3:07 / km)
Total:
41:12
Target first bike group at the bike finishGoal: finish the bike split with the first bike group.
Estimated requirement:
Swim time: 9:06
Pace: 1:13 / 100 m
About 19.6 s faster in the swim
Maximum predicted gap after the swim: +8.9 s
The complete bike-group simulation, including catches and group mergers, is recalculated through the end of the bike split.
|
| 11 / 9 |
Daniel Ubilla Sabada
CHI
|
+35 s
+39 s
|
G2 / G2
correct
|
15:38
15:13
|
41:12 | Show detailsPlacementPrediction: 11
80% range: 5–42
Top-10 probability: 35 %
Result: 9
Deviation: 2
SwimmingPrognoseabstand: +35 s
Time: 9:32
Pace: 1:16 / 100 m
Ergebnisabstand: +39 s
Fehler: -4.2 s
H2H: 46 Gegner:innen,
139 Duelle,
Korrektur -0.06 %,
Sicherheit 100 %
CyclingPrediction: Group 2 (23 people)
Gruppe 1: 9 %
Speed: 44.8 km/h
Initial Gruppe 4, später eingeholt/vereinigt
Gap ahead:
1.2 s
Gap behind:
0.0 s
Result: Group 2 (29 people)
Speed: 40.6 km/h
Tempo-Fehler: 4.17 km/h
Running and totalRun: 15:38 (3:08 / km)
Historical basis: 3:12 / km
Best comparable pace: 2:46 / km
Trend: −0:03 / km
Comparable races: 7
H2H: 46 Gegner:innen,
140 Duelle,
Korrektur -0.55 %,
Sicherheit 100 %
Ergebnis Lauf: 15:13 (3:03 / km)
Error: +0:25 / +0:05 / km
Overall prediction: 41:12
Data basis: 12 Races · Confidence 1.00
Swimming:
9:32
(1:16 / 100 m)
To the end of cycling (group time):
24:47
(44.8 km/h)
Run:
15:38
(3:08 / km)
Total:
41:12
Target first bike group at the bike finishGoal: finish the bike split with the first bike group.
Estimated requirement:
Swim time: 9:06
Pace: 1:13 / 100 m
About 25.9 s faster in the swim
Maximum predicted gap after the swim: +8.9 s
The complete bike-group simulation, including catches and group mergers, is recalculated through the end of the bike split.
|
| 12 / 38 |
Erick Arturo Ortigoza Rodriguez
MEX
|
+32 s
+65 s
|
G3 / G2
|
15:42
18:01
|
41:17 | Show detailsPlacementPrediction: 12
80% range: 4–45
Top-10 probability: 35 %
Result: 38
Deviation: -26
SwimmingPrognoseabstand: +32 s
Time: 9:29
Pace: 1:16 / 100 m
Ergebnisabstand: +65 s
Fehler: -33.5 s
H2H: 36 Gegner:innen,
61 Duelle,
Korrektur -0.01 %,
Sicherheit 100 %
CyclingPrediction: Group 3 (12 people)
Gruppe 1: 6 %
Speed: 44.3 km/h
Initial Gruppe 3, später eingeholt/vereinigt
Gap ahead:
2.1 s
Gap behind:
0.9 s
Result: Group 2 (29 people)
Speed: 41.1 km/h
Tempo-Fehler: 3.18 km/h
Running and totalRun: 15:42 (3:08 / km)
Historical basis: 3:12 / km
Best comparable pace: 2:56 / km
Trend: −0:04 / km
Comparable races: 7
H2H: 37 Gegner:innen,
62 Duelle,
Korrektur -0.10 %,
Sicherheit 100 %
Ergebnis Lauf: 18:01 (3:36 / km)
Error: −2:19 / −0:28 / km
Overall prediction: 41:17
Data basis: 12 Races · Confidence 1.00
Swimming:
9:29
(1:16 / 100 m)
To the end of cycling (group time):
25:04
(44.3 km/h)
Run:
15:42
(3:08 / km)
Total:
41:17
Target first bike group at the bike finishGoal: finish the bike split with the first bike group.
Estimated requirement:
Swim time: 9:06
Pace: 1:13 / 100 m
About 22.6 s faster in the swim
Maximum predicted gap after the swim: +8.9 s
The complete bike-group simulation, including catches and group mergers, is recalculated through the end of the bike split.
|
| 13 / 14 |
Sebastian Zurob
CHI
|
+35 s
+31 s
|
G2 / G2
correct
|
15:44
15:34
|
41:18 | Show detailsPlacementPrediction: 13
80% range: 6–36
Top-10 probability: 30 %
Result: 14
Deviation: -1
SwimmingPrognoseabstand: +35 s
Time: 9:32
Pace: 1:16 / 100 m
Ergebnisabstand: +31 s
Fehler: 4.2 s
H2H: 42 Gegner:innen,
89 Duelle,
Korrektur -0.13 %,
Sicherheit 100 %
CyclingPrediction: Group 2 (23 people)
Gruppe 1: 3 %
Speed: 44.8 km/h
Initial Gruppe 4, später eingeholt/vereinigt
Gap ahead:
0.1 s
Gap behind:
0.2 s
Result: Group 2 (29 people)
Speed: 40.4 km/h
Tempo-Fehler: 4.37 km/h
Running and totalRun: 15:44 (3:09 / km)
Historical basis: 3:13 / km
Best comparable pace: 2:52 / km
Trend: −0:03 / km
Comparable races: 7
H2H: 42 Gegner:innen,
89 Duelle,
Korrektur -0.35 %,
Sicherheit 100 %
Ergebnis Lauf: 15:34 (3:07 / km)
Error: +0:10 / +0:02 / km
Overall prediction: 41:18
Data basis: 12 Races · Confidence 1.00
Swimming:
9:32
(1:16 / 100 m)
To the end of cycling (group time):
24:47
(44.8 km/h)
Run:
15:44
(3:09 / km)
Total:
41:18
Target first bike group at the bike finishGoal: finish the bike split with the first bike group.
Estimated requirement:
Swim time: 9:28
Pace: 1:16 / 100 m
About 3.8 s faster in the swim
Maximum predicted gap after the swim: +31.4 s
The complete bike-group simulation, including catches and group mergers, is recalculated through the end of the bike split.
|
| 14 / 25 |
 Alfredo Miguel Rodríguez Figueroa
MEX
|
+35 s
+55 s
|
G2 / G2
correct
|
15:45
16:15
|
41:19 | Show detailsPlacementPrediction: 14
80% range: 10–30
Top-10 probability: 14 %
Result: 25
Deviation: -11
SwimmingPrognoseabstand: +35 s
Time: 9:32
Pace: 1:16 / 100 m
Ergebnisabstand: +55 s
Fehler: -19.6 s
H2H: 50 Gegner:innen,
128 Duelle,
Korrektur -0.34 %,
Sicherheit 100 %
CyclingPrediction: Group 2 (23 people)
Gruppe 1: 14 %
Speed: 44.8 km/h
Initial Gruppe 4, später eingeholt/vereinigt
Gap ahead:
0.2 s
Gap behind:
0.9 s
Result: Group 2 (29 people)
Speed: 41.0 km/h
Tempo-Fehler: 3.74 km/h
Running and totalRun: 15:45 (3:09 / km)
Historical basis: 3:10 / km
Best comparable pace: 2:53 / km
Trend: −0:00 / km
Comparable races: 9
H2H: 50 Gegner:innen,
129 Duelle,
Korrektur -0.34 %,
Sicherheit 100 %
Ergebnis Lauf: 16:15 (3:15 / km)
Error: −0:30 / −0:06 / km
Overall prediction: 41:19
Data basis: 12 Races · Confidence 1.00
Swimming:
9:32
(1:16 / 100 m)
To the end of cycling (group time):
24:47
(44.8 km/h)
Run:
15:45
(3:09 / km)
Total:
41:19
Target first bike group at the bike finishGoal: finish the bike split with the first bike group.
Estimated requirement:
Swim time: 9:28
Pace: 1:16 / 100 m
About 4 s faster in the swim
Maximum predicted gap after the swim: +31.4 s
The complete bike-group simulation, including catches and group mergers, is recalculated through the end of the bike split.
|
| 15 / 4 |
 Zach Leachman
USA
|
+68 s
+65 s
|
G5 / G2
|
13:21
14:41
|
41:20 | Show detailsPlacementPrediction: 15
80% range: 2–8
Top-10 probability: 93 %
Result: 4
Deviation: 11
SwimmingPrognoseabstand: +68 s
Time: 10:05
Pace: 1:21 / 100 m
Ergebnisabstand: +65 s
Fehler: 3.4 s
H2H: 39 Gegner:innen,
48 Duelle,
Korrektur -0.21 %,
Sicherheit 100 %
CyclingPrediction: Group 5 (6 people)
Gruppe 1: 0 %
Speed: 41.5 km/h
Initial Gruppe 6, später eingeholt/vereinigt
Gap ahead:
2.7 s
Gap behind:
0.0 s
Result: Group 2 (29 people)
Speed: 41.2 km/h
Tempo-Fehler: 0.31 km/h
Running and totalRun: 13:21 (2:40 / km)
Historical basis: 2:40 / km
Best comparable pace: 2:40 / km
Trend: −0:02 / km
Comparable races: 4
H2H: 39 Gegner:innen,
48 Duelle,
Korrektur 1.03 %,
Sicherheit 100 %
Ergebnis Lauf: 14:41 (2:56 / km)
Error: −1:20 / −0:16 / km
Overall prediction: 41:20
Data basis: 11 Races · Confidence 1.00
Swimming:
10:05
(1:21 / 100 m)
To the end of cycling (group time):
26:44
(41.5 km/h)
Run:
13:21
(2:40 / km)
Total:
41:20
Target first bike group at the bike finishGoal: finish the bike split with the first bike group.
Estimated requirement:
Swim time: 9:28
Pace: 1:16 / 100 m
About 37 s faster in the swim
Maximum predicted gap after the swim: +31.4 s
The complete bike-group simulation, including catches and group mergers, is recalculated through the end of the bike split.
|
| 16 / 18 |
 Yael Vladimir González Melendez
MEX
|
+29 s
+79 s
|
G3 / G2
|
15:47
15:42
|
41:22 | Show detailsPlacementPrediction: 16
80% range: 9–28
Top-10 probability: 15 %
Result: 18
Deviation: -2
SwimmingPrognoseabstand: +29 s
Time: 9:26
Pace: 1:15 / 100 m
Ergebnisabstand: +79 s
Fehler: -49.6 s
H2H: 50 Gegner:innen,
142 Duelle,
Korrektur 0.22 %,
Sicherheit 100 %
CyclingPrediction: Group 3 (12 people)
Gruppe 1: 15 %
Speed: 44.3 km/h
Initial Gruppe 3, später eingeholt/vereinigt
Gap ahead:
0.9 s
Gap behind:
2.1 s
Result: Group 2 (29 people)
Speed: 41.7 km/h
Tempo-Fehler: 2.59 km/h
Running and totalRun: 15:47 (3:09 / km)
Historical basis: 3:13 / km
Best comparable pace: 2:55 / km
Trend: −0:04 / km
Comparable races: 9
H2H: 50 Gegner:innen,
142 Duelle,
Korrektur -0.30 %,
Sicherheit 100 %
Ergebnis Lauf: 15:42 (3:08 / km)
Error: +0:05 / +0:01 / km
Overall prediction: 41:22
Data basis: 12 Races · Confidence 1.00
Swimming:
9:26
(1:15 / 100 m)
To the end of cycling (group time):
25:04
(44.3 km/h)
Run:
15:47
(3:09 / km)
Total:
41:22
Target first bike group at the bike finishGoal: finish the bike split with the first bike group.
Estimated requirement:
Swim time: 9:10
Pace: 1:13 / 100 m
About 16 s faster in the swim
Maximum predicted gap after the swim: +13.4 s
The complete bike-group simulation, including catches and group mergers, is recalculated through the end of the bike split.
|
| 17 / 16 |
 Isaac Lamprecht
USA
|
+43 s
+66 s
|
G2 / G2
correct
|
15:50
15:33
|
41:24 | Show detailsPlacementPrediction: 17
80% range: 8–46
Top-10 probability: 19 %
Result: 16
Deviation: 1
SwimmingPrognoseabstand: +43 s
Time: 9:40
Pace: 1:17 / 100 m
Ergebnisabstand: +66 s
Fehler: -22.9 s
H2H: 23 Gegner:innen,
35 Duelle,
Korrektur 0.47 %,
Sicherheit 100 %
CyclingPrediction: Group 2 (23 people)
Gruppe 1: 0 %
Speed: 44.8 km/h
Initial Gruppe 4, später eingeholt/vereinigt
Gap ahead:
2.6 s
Gap behind:
0.4 s
Result: Group 2 (29 people)
Speed: 41.4 km/h
Tempo-Fehler: 3.39 km/h
Running and totalRun: 15:50 (3:10 / km)
Historical basis: 3:13 / km
Best comparable pace: 2:54 / km
Trend: −0:03 / km
Comparable races: 9
H2H: 23 Gegner:innen,
35 Duelle,
Korrektur 0.33 %,
Sicherheit 93 %
Ergebnis Lauf: 15:33 (3:07 / km)
Error: +0:17 / +0:03 / km
Overall prediction: 41:24
Data basis: 12 Races · Confidence 1.00
Swimming:
9:40
(1:17 / 100 m)
To the end of cycling (group time):
24:47
(44.8 km/h)
Run:
15:50
(3:10 / km)
Total:
41:24
Target first bike group at the bike finishGoal: finish the bike split with the first bike group.
Estimated requirement:
Swim time: 9:06
Pace: 1:13 / 100 m
About 34.2 s faster in the swim
Maximum predicted gap after the swim: +8.9 s
The complete bike-group simulation, including catches and group mergers, is recalculated through the end of the bike split.
|
| 18 / 36 |
Eyal Chen
ISR
|
+32 s
+78 s
|
G2 / G4
|
15:53
15:55
|
41:27 | Show detailsPlacementPrediction: 18
80% range: 14–28
Top-10 probability: 4 %
Result: 36
Deviation: -18
SwimmingPrognoseabstand: +32 s
Time: 9:29
Pace: 1:16 / 100 m
Ergebnisabstand: +78 s
Fehler: -45.6 s
H2H: 3 Gegner:innen,
4 Duelle,
Korrektur 0.69 %,
Sicherheit 7 %
CyclingPrediction: Group 2 (23 people)
Gruppe 1: 3 %
Speed: 44.8 km/h
Initial Gruppe 4, später eingeholt/vereinigt
Gap ahead:
0.0 s
Gap behind:
1.2 s
Result: Group 4 (12 people)
Speed: 38.5 km/h
Tempo-Fehler: 6.26 km/h
Running and totalRun: 15:53 (3:11 / km)
Historical basis: 3:10 / km
Best comparable pace: 2:54 / km
Trend: +0:00 / km
Comparable races: 3
H2H: 2 Gegner:innen,
2 Duelle,
Korrektur 0.23 %,
Sicherheit 6 %
Ergebnis Lauf: 15:55 (3:11 / km)
Error: −0:02 / −0:00 / km
Overall prediction: 41:27
Data basis: 8 Races · Confidence 1.00
Swimming:
9:29
(1:16 / 100 m)
To the end of cycling (group time):
24:47
(44.8 km/h)
Run:
15:53
(3:11 / km)
Total:
41:27
Target first bike group at the bike finishGoal: finish the bike split with the first bike group.
Estimated requirement:
Swim time: 9:06
Pace: 1:13 / 100 m
About 23.5 s faster in the swim
Maximum predicted gap after the swim: +8.9 s
The complete bike-group simulation, including catches and group mergers, is recalculated through the end of the bike split.
|
| 19 / 7 |
_-_JR2017.JPG) Aiden Longcroft-Harris
Aiden Longcroft-Harris
CAN
|
+5 s
+14 s
|
G1 / G1
correct
|
16:13
15:35
|
41:35 | Show detailsPlacementPrediction: 19
80% range: 12–28
Top-10 probability: 6 %
Result: 7
Deviation: 12
SwimmingPrognoseabstand: +5 s
Time: 9:02
Pace: 1:12 / 100 m
Ergebnisabstand: +14 s
Fehler: -9.0 s
H2H: 39 Gegner:innen,
92 Duelle,
Korrektur 0.78 %,
Sicherheit 100 %
CyclingPrediction: Group 1 (2 people)
Gruppe 1: 86 %
Speed: 43.9 km/h
Gap ahead:
1.9 s
Gap behind:
4.4 s
Result: Group 1 (6 people)
Speed: 41.0 km/h
Tempo-Fehler: 2.91 km/h
Running and totalRun: 16:13 (3:15 / km)
Historical basis: 3:16 / km
Best comparable pace: 2:56 / km
Trend: +0:00 / km
Comparable races: 7
H2H: 39 Gegner:innen,
92 Duelle,
Korrektur -0.88 %,
Sicherheit 100 %
Ergebnis Lauf: 15:35 (3:07 / km)
Error: +0:38 / +0:08 / km
Overall prediction: 41:35
Data basis: 12 Races · Confidence 1.00
Swimming:
9:02
(1:12 / 100 m)
To the end of cycling (group time):
25:17
(43.9 km/h)
Run:
16:13
(3:15 / km)
Total:
41:35
|
| 20 / 8 |
Porter Middaugh
USA
|
+48 s
+58 s
|
G4 / G2
|
15:35
15:10
|
41:36 | Show detailsPlacementPrediction: 20
80% range: 8–34
Top-10 probability: 16 %
Result: 8
Deviation: 12
SwimmingPrognoseabstand: +48 s
Time: 9:45
Pace: 1:18 / 100 m
Ergebnisabstand: +58 s
Fehler: -10.5 s
H2H: 33 Gegner:innen,
64 Duelle,
Korrektur 0.34 %,
Sicherheit 100 %
CyclingPrediction: Group 4 (15 people)
Gruppe 1: 0 %
Speed: 44.4 km/h
Initial Gruppe 5, später eingeholt/vereinigt
Gap ahead:
1.3 s
Gap behind:
0.7 s
Result: Group 2 (29 people)
Speed: 41.1 km/h
Tempo-Fehler: 3.24 km/h
Running and totalRun: 15:35 (3:07 / km)
Historical basis: 3:07 / km
Best comparable pace: 2:55 / km
Trend: +0:00 / km
Comparable races: 9
H2H: 33 Gegner:innen,
65 Duelle,
Korrektur -0.04 %,
Sicherheit 100 %
Ergebnis Lauf: 15:10 (3:02 / km)
Error: +0:25 / +0:05 / km
Overall prediction: 41:36
Data basis: 12 Races · Confidence 1.00
Swimming:
9:45
(1:18 / 100 m)
To the end of cycling (group time):
25:01
(44.4 km/h)
Run:
15:35
(3:07 / km)
Total:
41:36
Target first bike group at the bike finishGoal: finish the bike split with the first bike group.
Estimated requirement:
Swim time: 9:29
Pace: 1:16 / 100 m
About 16.1 s faster in the swim
Maximum predicted gap after the swim: +31.4 s
The complete bike-group simulation, including catches and group mergers, is recalculated through the end of the bike split.
|
| 21 / 30 |
Solen Wood
CAN
|
+41 s
+60 s
|
G2 / G2
correct
|
16:04
16:40
|
41:38 | Show detailsPlacementPrediction: 21
80% range: 20–32
Top-10 probability: 0 %
Result: 30
Deviation: -9
SwimmingPrognoseabstand: +41 s
Time: 9:38
Pace: 1:17 / 100 m
Ergebnisabstand: +60 s
Fehler: -19.5 s
H2H: 20 Gegner:innen,
34 Duelle,
Korrektur -0.49 %,
Sicherheit 100 %
CyclingPrediction: Group 2 (23 people)
Gruppe 1: 1 %
Speed: 44.8 km/h
Initial Gruppe 4, später eingeholt/vereinigt
Gap ahead:
0.5 s
Gap behind:
2.6 s
Result: Group 2 (29 people)
Speed: 41.1 km/h
Tempo-Fehler: 3.64 km/h
Running and totalRun: 16:04 (3:13 / km)
Historical basis: 3:14 / km
Best comparable pace: 3:12 / km
Trend: −0:01 / km
Comparable races: 4
H2H: 20 Gegner:innen,
34 Duelle,
Korrektur -0.07 %,
Sicherheit 85 %
Ergebnis Lauf: 16:40 (3:20 / km)
Error: −0:36 / −0:07 / km
Overall prediction: 41:38
Data basis: 12 Races · Confidence 1.00
Swimming:
9:38
(1:17 / 100 m)
To the end of cycling (group time):
24:47
(44.8 km/h)
Run:
16:04
(3:13 / km)
Total:
41:38
Target first bike group at the bike finishGoal: finish the bike split with the first bike group.
Estimated requirement:
Swim time: 9:06
Pace: 1:13 / 100 m
About 31.6 s faster in the swim
Maximum predicted gap after the swim: +8.9 s
The complete bike-group simulation, including catches and group mergers, is recalculated through the end of the bike split.
|
| 22 / 28 |
Emilio Antonio Ibarra Veyna
MEX
|
+44 s
+64 s
|
G2 / G3
|
16:05
15:57
|
41:39 | Show detailsPlacementPrediction: 22
80% range: 7–53
Top-10 probability: 20 %
Result: 28
Deviation: -6
SwimmingPrognoseabstand: +44 s
Time: 9:41
Pace: 1:17 / 100 m
Ergebnisabstand: +64 s
Fehler: -20.5 s
H2H: 45 Gegner:innen,
103 Duelle,
Korrektur -0.26 %,
Sicherheit 100 %
CyclingPrediction: Group 2 (23 people)
Gruppe 1: 14 %
Speed: 44.8 km/h
Initial Gruppe 4, später eingeholt/vereinigt
Gap ahead:
0.4 s
Gap behind:
1.4 s
Result: Group 3 (5 people)
Speed: 40.5 km/h
Tempo-Fehler: 4.32 km/h
Running and totalRun: 16:05 (3:13 / km)
Historical basis: 3:16 / km
Best comparable pace: 3:02 / km
Trend: −0:04 / km
Comparable races: 8
H2H: 46 Gegner:innen,
104 Duelle,
Korrektur 0.13 %,
Sicherheit 100 %
Ergebnis Lauf: 15:57 (3:11 / km)
Error: +0:08 / +0:02 / km
Overall prediction: 41:39
Data basis: 8 Races · Confidence 1.00
Swimming:
9:41
(1:17 / 100 m)
To the end of cycling (group time):
24:47
(44.8 km/h)
Run:
16:05
(3:13 / km)
Total:
41:39
Target first bike group at the bike finishGoal: finish the bike split with the first bike group.
Estimated requirement:
Swim time: 9:29
Pace: 1:16 / 100 m
About 12.1 s faster in the swim
Maximum predicted gap after the swim: +31.4 s
The complete bike-group simulation, including catches and group mergers, is recalculated through the end of the bike split.
|
| 23 / 17 |
 Alvaro Campos Solano
CRC
|
+13 s
+20 s
|
G3 / G2
|
16:05
15:43
|
41:40 | Show detailsPlacementPrediction: 23
80% range: 13–29
Top-10 probability: 6 %
Result: 17
Deviation: 6
SwimmingPrognoseabstand: +13 s
Time: 9:10
Pace: 1:13 / 100 m
Ergebnisabstand: +20 s
Fehler: -6.9 s
H2H: 45 Gegner:innen,
190 Duelle,
Korrektur 0.63 %,
Sicherheit 100 %
CyclingPrediction: Group 3 (12 people)
Gruppe 1: 48 %
Speed: 44.3 km/h
Initial Gruppe 2, später eingeholt/vereinigt
Gap ahead:
3.7 s
Gap behind:
4.4 s
Result: Group 2 (29 people)
Speed: 40.4 km/h
Tempo-Fehler: 3.96 km/h
Running and totalRun: 16:05 (3:13 / km)
Historical basis: 3:17 / km
Best comparable pace: 3:06 / km
Trend: −0:03 / km
Comparable races: 9
H2H: 44 Gegner:innen,
184 Duelle,
Korrektur -0.36 %,
Sicherheit 100 %
Ergebnis Lauf: 15:43 (3:09 / km)
Error: +0:22 / +0:05 / km
Overall prediction: 41:40
Data basis: 12 Races · Confidence 1.00
Swimming:
9:10
(1:13 / 100 m)
To the end of cycling (group time):
25:04
(44.3 km/h)
Run:
16:05
(3:13 / km)
Total:
41:40
Target first bike group at the bike finishGoal: finish the bike split with the first bike group.
Estimated requirement:
Swim time: 9:06
Pace: 1:13 / 100 m
About 4.2 s faster in the swim
Maximum predicted gap after the swim: +8.9 s
The complete bike-group simulation, including catches and group mergers, is recalculated through the end of the bike split.
|
| 24 / 15 |
Tiago Muñoz
ARG
|
+50 s
+82 s
|
G4 / G2
|
15:40
15:26
|
41:41 | Show detailsPlacementPrediction: 24
80% range: 12–37
Top-10 probability: 5 %
Result: 15
Deviation: 9
SwimmingPrognoseabstand: +50 s
Time: 9:47
Pace: 1:18 / 100 m
Ergebnisabstand: +82 s
Fehler: -31.7 s
H2H: 53 Gegner:innen,
188 Duelle,
Korrektur -0.07 %,
Sicherheit 100 %
CyclingPrediction: Group 4 (15 people)
Gruppe 1: 4 %
Speed: 44.4 km/h
Initial Gruppe 5, später eingeholt/vereinigt
Gap ahead:
0.5 s
Gap behind:
1.0 s
Result: Group 2 (29 people)
Speed: 41.5 km/h
Tempo-Fehler: 2.88 km/h
Running and totalRun: 15:40 (3:08 / km)
Historical basis: 3:12 / km
Best comparable pace: 2:51 / km
Trend: −0:03 / km
Comparable races: 11
H2H: 53 Gegner:innen,
181 Duelle,
Korrektur -0.36 %,
Sicherheit 100 %
Ergebnis Lauf: 15:26 (3:05 / km)
Error: +0:14 / +0:03 / km
Overall prediction: 41:41
Data basis: 12 Races · Confidence 1.00
Swimming:
9:47
(1:18 / 100 m)
To the end of cycling (group time):
25:01
(44.4 km/h)
Run:
15:40
(3:08 / km)
Total:
41:41
Target first bike group at the bike finishGoal: finish the bike split with the first bike group.
Estimated requirement:
Swim time: 9:06
Pace: 1:13 / 100 m
About 41.4 s faster in the swim
Maximum predicted gap after the swim: +8.9 s
The complete bike-group simulation, including catches and group mergers, is recalculated through the end of the bike split.
|
| 25 / 45 |
Lucas Galdino
BRA
|
+51 s
+85 s
|
G4 / G4
correct
|
15:43
17:01
|
41:44 | Show detailsPlacementPrediction: 25
80% range: 10–48
Top-10 probability: 14 %
Result: 45
Deviation: -20
SwimmingPrognoseabstand: +51 s
Time: 9:48
Pace: 1:18 / 100 m
Ergebnisabstand: +85 s
Fehler: -33.7 s
H2H: 41 Gegner:innen,
76 Duelle,
Korrektur -0.06 %,
Sicherheit 100 %
CyclingPrediction: Group 4 (15 people)
Gruppe 1: 3 %
Speed: 44.4 km/h
Initial Gruppe 5, später eingeholt/vereinigt
Gap ahead:
1.0 s
Gap behind:
0.0 s
Result: Group 4 (12 people)
Speed: 38.9 km/h
Tempo-Fehler: 5.45 km/h
Running and totalRun: 15:43 (3:09 / km)
Historical basis: 3:07 / km
Best comparable pace: 3:01 / km
Trend: +0:00 / km
Comparable races: 4
H2H: 41 Gegner:innen,
76 Duelle,
Korrektur 0.85 %,
Sicherheit 100 %
Ergebnis Lauf: 17:01 (3:24 / km)
Error: −1:18 / −0:16 / km
Overall prediction: 41:44
Data basis: 5 Races · Confidence 1.00
Swimming:
9:48
(1:18 / 100 m)
To the end of cycling (group time):
25:01
(44.4 km/h)
Run:
15:43
(3:09 / km)
Total:
41:44
Target first bike group at the bike finishGoal: finish the bike split with the first bike group.
Estimated requirement:
Swim time: 9:28
Pace: 1:16 / 100 m
About 19.9 s faster in the swim
Maximum predicted gap after the swim: +31.4 s
The complete bike-group simulation, including catches and group mergers, is recalculated through the end of the bike split.
|
| 26 / 35 |
Victor Hugo Lopes Pereira Da Silva
BRA
|
+36 s
+35 s
|
G2 / G2
correct
|
16:16
17:50
|
41:50 | Show detailsPlacementPrediction: 26
80% range: 19–37
Top-10 probability: 0 %
Result: 35
Deviation: -9
SwimmingPrognoseabstand: +36 s
Time: 9:33
Pace: 1:16 / 100 m
Ergebnisabstand: +35 s
Fehler: 1.3 s
H2H: 41 Gegner:innen,
73 Duelle,
Korrektur -0.25 %,
Sicherheit 100 %
CyclingPrediction: Group 2 (23 people)
Gruppe 1: 23 %
Speed: 44.8 km/h
Initial Gruppe 4, später eingeholt/vereinigt
Gap ahead:
0.9 s
Gap behind:
0.6 s
Result: Group 2 (29 people)
Speed: 40.8 km/h
Tempo-Fehler: 3.99 km/h
Running and totalRun: 16:16 (3:15 / km)
Historical basis: 3:17 / km
Best comparable pace: 3:07 / km
Trend: −0:04 / km
Comparable races: 5
H2H: 41 Gegner:innen,
73 Duelle,
Korrektur 1.01 %,
Sicherheit 100 %
Ergebnis Lauf: 17:50 (3:34 / km)
Error: −1:34 / −0:19 / km
Overall prediction: 41:50
Data basis: 7 Races · Confidence 1.00
Swimming:
9:33
(1:16 / 100 m)
To the end of cycling (group time):
24:47
(44.8 km/h)
Run:
16:16
(3:15 / km)
Total:
41:50
Target first bike group at the bike finishGoal: finish the bike split with the first bike group.
Estimated requirement:
Swim time: 9:28
Pace: 1:16 / 100 m
About 4.9 s faster in the swim
Maximum predicted gap after the swim: +31.4 s
The complete bike-group simulation, including catches and group mergers, is recalculated through the end of the bike split.
|
| 27 / 46 |
Marcos Alejandro Fernández González
CUB
|
+35 s
+56 s
|
G2 / G4
|
16:21
17:08
|
41:55 | Show detailsPlacementPrediction: 27
80% range: 14–48
Top-10 probability: 8 %
Result: 46
Deviation: -19
SwimmingPrognoseabstand: +35 s
Time: 9:32
Pace: 1:16 / 100 m
Ergebnisabstand: +56 s
Fehler: -21.2 s
H2H: 41 Gegner:innen,
59 Duelle,
Korrektur 0.57 %,
Sicherheit 100 %
CyclingPrediction: Group 2 (23 people)
Gruppe 1: 14 %
Speed: 44.8 km/h
Initial Gruppe 4, später eingeholt/vereinigt
Gap ahead:
0.0 s
Gap behind:
0.3 s
Result: Group 4 (12 people)
Speed: 38.3 km/h
Tempo-Fehler: 6.44 km/h
Running and totalRun: 16:21 (3:16 / km)
Historical basis: 3:21 / km
Best comparable pace: 2:57 / km
Trend: −0:04 / km
Comparable races: 9
H2H: 41 Gegner:innen,
58 Duelle,
Korrektur -0.66 %,
Sicherheit 100 %
Ergebnis Lauf: 17:08 (3:26 / km)
Error: −0:47 / −0:09 / km
Overall prediction: 41:55
Data basis: 12 Races · Confidence 1.00
Swimming:
9:32
(1:16 / 100 m)
To the end of cycling (group time):
24:47
(44.8 km/h)
Run:
16:21
(3:16 / km)
Total:
41:55
Target first bike group at the bike finishGoal: finish the bike split with the first bike group.
Estimated requirement:
Swim time: 9:06
Pace: 1:13 / 100 m
About 25.9 s faster in the swim
Maximum predicted gap after the swim: +8.9 s
The complete bike-group simulation, including catches and group mergers, is recalculated through the end of the bike split.
|
| 28 / 59 |
Raziel Geovanni Muñoz Tun
MEX
|
+51 s
+81 s
|
G4 / G6
|
15:55
17:08
|
41:56 | Show detailsPlacementPrediction: 28
80% range: 11–48
Top-10 probability: 10 %
Result: 59
Deviation: -31
SwimmingPrognoseabstand: +51 s
Time: 9:48
Pace: 1:18 / 100 m
Ergebnisabstand: +81 s
Fehler: -29.7 s
H2H: 46 Gegner:innen,
86 Duelle,
Korrektur -0.43 %,
Sicherheit 100 %
CyclingPrediction: Group 4 (15 people)
Gruppe 1: 0 %
Speed: 44.4 km/h
Initial Gruppe 5, später eingeholt/vereinigt
Gap ahead:
0.0 s
Gap behind:
0.4 s
Result: Group 6 (5 people)
Speed: 35.7 km/h
Tempo-Fehler: 8.62 km/h
Running and totalRun: 15:55 (3:11 / km)
Historical basis: 3:14 / km
Best comparable pace: 3:06 / km
Trend: −0:04 / km
Comparable races: 6
H2H: 46 Gegner:innen,
86 Duelle,
Korrektur 0.53 %,
Sicherheit 100 %
Ergebnis Lauf: 17:08 (3:26 / km)
Error: −1:13 / −0:15 / km
Overall prediction: 41:56
Data basis: 6 Races · Confidence 1.00
Swimming:
9:48
(1:18 / 100 m)
To the end of cycling (group time):
25:01
(44.4 km/h)
Run:
15:55
(3:11 / km)
Total:
41:56
Target first bike group at the bike finishGoal: finish the bike split with the first bike group.
Estimated requirement:
Swim time: 9:06
Pace: 1:13 / 100 m
About 42.4 s faster in the swim
Maximum predicted gap after the swim: +8.9 s
The complete bike-group simulation, including catches and group mergers, is recalculated through the end of the bike split.
|
| 29 / 12 |
Ignacio Flores Arana
CHI
|
+52 s
+64 s
|
G4 / G2
|
15:56
15:31
|
41:57 | Show detailsPlacementPrediction: 29
80% range: 14–49
Top-10 probability: 5 %
Result: 12
Deviation: 17
SwimmingPrognoseabstand: +52 s
Time: 9:49
Pace: 1:19 / 100 m
Ergebnisabstand: +64 s
Fehler: -12.3 s
H2H: 39 Gegner:innen,
89 Duelle,
Korrektur -0.01 %,
Sicherheit 100 %
CyclingPrediction: Group 4 (15 people)
Gruppe 1: 1 %
Speed: 44.4 km/h
Initial Gruppe 5, später eingeholt/vereinigt
Gap ahead:
0.4 s
Gap behind:
0.3 s
Result: Group 2 (29 people)
Speed: 41.2 km/h
Tempo-Fehler: 3.16 km/h
Running and totalRun: 15:56 (3:11 / km)
Historical basis: 3:15 / km
Best comparable pace: 3:05 / km
Trend: −0:04 / km
Comparable races: 7
H2H: 39 Gegner:innen,
90 Duelle,
Korrektur 0.00 %,
Sicherheit 100 %
Ergebnis Lauf: 15:31 (3:06 / km)
Error: +0:25 / +0:05 / km
Overall prediction: 41:57
Data basis: 12 Races · Confidence 1.00
Swimming:
9:49
(1:19 / 100 m)
To the end of cycling (group time):
25:01
(44.4 km/h)
Run:
15:56
(3:11 / km)
Total:
41:57
Target first bike group at the bike finishGoal: finish the bike split with the first bike group.
Estimated requirement:
Swim time: 9:06
Pace: 1:13 / 100 m
About 42.8 s faster in the swim
Maximum predicted gap after the swim: +8.9 s
The complete bike-group simulation, including catches and group mergers, is recalculated through the end of the bike split.
|
| 30 / 29 |
Thomas Castañeda Maldonado
ARG
|
+46 s
+91 s
|
G2 / G2
correct
|
16:24
16:20
|
41:58 | Show detailsPlacementPrediction: 30
80% range: 18–46
Top-10 probability: 3 %
Result: 29
Deviation: 1
SwimmingPrognoseabstand: +46 s
Time: 9:43
Pace: 1:18 / 100 m
Ergebnisabstand: +91 s
Fehler: -44.8 s
H2H: 51 Gegner:innen,
216 Duelle,
Korrektur -0.42 %,
Sicherheit 100 %
CyclingPrediction: Group 2 (23 people)
Gruppe 1: 10 %
Speed: 44.8 km/h
Initial Gruppe 4, später eingeholt/vereinigt
Gap ahead:
0.5 s
Gap behind:
1.3 s
Result: Group 2 (29 people)
Speed: 41.8 km/h
Tempo-Fehler: 3.02 km/h
Running and totalRun: 16:24 (3:17 / km)
Historical basis: 3:18 / km
Best comparable pace: 3:03 / km
Trend: −0:01 / km
Comparable races: 8
H2H: 51 Gegner:innen,
217 Duelle,
Korrektur -0.11 %,
Sicherheit 100 %
Ergebnis Lauf: 16:20 (3:16 / km)
Error: +0:04 / +0:01 / km
Overall prediction: 41:58
Data basis: 12 Races · Confidence 1.00
Swimming:
9:43
(1:18 / 100 m)
To the end of cycling (group time):
24:47
(44.8 km/h)
Run:
16:24
(3:17 / km)
Total:
41:58
Target first bike group at the bike finishGoal: finish the bike split with the first bike group.
Estimated requirement:
Swim time: 9:28
Pace: 1:16 / 100 m
About 14.8 s faster in the swim
Maximum predicted gap after the swim: +31.4 s
The complete bike-group simulation, including catches and group mergers, is recalculated through the end of the bike split.
|
| 31 / 50 |
Luis Miguel Chávez Sanchez
MEX
|
+61 s
+69 s
|
G4 / G4
correct
|
16:00
17:38
|
42:01 | Show detailsPlacementPrediction: 31
80% range: 16–52
Top-10 probability: 6 %
Result: 50
Deviation: -19
SwimmingPrognoseabstand: +61 s
Time: 9:58
Pace: 1:20 / 100 m
Ergebnisabstand: +69 s
Fehler: -8.5 s
H2H: 47 Gegner:innen,
100 Duelle,
Korrektur -0.25 %,
Sicherheit 100 %
CyclingPrediction: Group 4 (15 people)
Gruppe 1: 0 %
Speed: 44.4 km/h
Initial Gruppe 5, später eingeholt/vereinigt
Gap ahead:
0.6 s
Gap behind:
5.2 s
Result: Group 4 (12 people)
Speed: 38.4 km/h
Tempo-Fehler: 5.96 km/h
Running and totalRun: 16:00 (3:12 / km)
Historical basis: 3:16 / km
Best comparable pace: 2:58 / km
Trend: −0:04 / km
Comparable races: 10
H2H: 47 Gegner:innen,
100 Duelle,
Korrektur -0.19 %,
Sicherheit 100 %
Ergebnis Lauf: 17:38 (3:32 / km)
Error: −1:38 / −0:20 / km
Overall prediction: 42:01
Data basis: 11 Races · Confidence 1.00
Swimming:
9:58
(1:20 / 100 m)
To the end of cycling (group time):
25:01
(44.4 km/h)
Run:
16:00
(3:12 / km)
Total:
42:01
Target first bike group at the bike finishGoal: finish the bike split with the first bike group.
Estimated requirement:
Swim time: 9:06
Pace: 1:13 / 100 m
About 51.6 s faster in the swim
Maximum predicted gap after the swim: +8.9 s
The complete bike-group simulation, including catches and group mergers, is recalculated through the end of the bike split.
|
| 32 / 52 |
 Thiago Gomide Moreira
BRA
|
+48 s
+96 s
|
G4 / G4
correct
|
16:04
18:04
|
42:05 | Show detailsPlacementPrediction: 32
80% range: 9–47
Top-10 probability: 16 %
Result: 52
Deviation: -20
SwimmingPrognoseabstand: +48 s
Time: 9:45
Pace: 1:18 / 100 m
Ergebnisabstand: +96 s
Fehler: -47.8 s
H2H: 43 Gegner:innen,
102 Duelle,
Korrektur -0.31 %,
Sicherheit 100 %
CyclingPrediction: Group 4 (15 people)
Gruppe 1: 1 %
Speed: 44.4 km/h
Initial Gruppe 5, später eingeholt/vereinigt
Gap ahead:
0.7 s
Gap behind:
0.3 s
Result: Group 4 (12 people)
Speed: 38.9 km/h
Tempo-Fehler: 5.45 km/h
Running and totalRun: 16:04 (3:13 / km)
Historical basis: 3:14 / km
Best comparable pace: 3:02 / km
Trend: −0:04 / km
Comparable races: 5
H2H: 43 Gegner:innen,
100 Duelle,
Korrektur 1.06 %,
Sicherheit 100 %
Ergebnis Lauf: 18:04 (3:37 / km)
Error: −2:00 / −0:24 / km
Overall prediction: 42:05
Data basis: 12 Races · Confidence 1.00
Swimming:
9:45
(1:18 / 100 m)
To the end of cycling (group time):
25:01
(44.4 km/h)
Run:
16:04
(3:13 / km)
Total:
42:05
Target first bike group at the bike finishGoal: finish the bike split with the first bike group.
Estimated requirement:
Swim time: 9:28
Pace: 1:16 / 100 m
About 16.8 s faster in the swim
Maximum predicted gap after the swim: +31.4 s
The complete bike-group simulation, including catches and group mergers, is recalculated through the end of the bike split.
|
| 33 / 13 |
Chris Gregor
CAN
|
+20 s
+22 s
|
G3 / G1
|
16:34
16:16
|
42:09 | Show detailsPlacementPrediction: 33
80% range: 7–47
Top-10 probability: 16 %
Result: 13
Deviation: 20
SwimmingPrognoseabstand: +20 s
Time: 9:17
Pace: 1:14 / 100 m
Ergebnisabstand: +22 s
Fehler: -2.0 s
H2H: 31 Gegner:innen,
76 Duelle,
Korrektur 0.22 %,
Sicherheit 100 %
CyclingPrediction: Group 3 (12 people)
Gruppe 1: 40 %
Speed: 44.3 km/h
Initial Gruppe 3, später eingeholt/vereinigt
Gap ahead:
2.5 s
Gap behind:
1.9 s
Result: Group 1 (6 people)
Speed: 41.1 km/h
Tempo-Fehler: 3.26 km/h
Running and totalRun: 16:34 (3:19 / km)
Historical basis: 3:23 / km
Best comparable pace: 3:10 / km
Trend: −0:04 / km
Comparable races: 9
H2H: 29 Gegner:innen,
74 Duelle,
Korrektur -0.25 %,
Sicherheit 100 %
Ergebnis Lauf: 16:16 (3:15 / km)
Error: +0:18 / +0:04 / km
Overall prediction: 42:09
Data basis: 12 Races · Confidence 1.00
Swimming:
9:17
(1:14 / 100 m)
To the end of cycling (group time):
25:04
(44.3 km/h)
Run:
16:34
(3:19 / km)
Total:
42:09
Target first bike group at the bike finishGoal: finish the bike split with the first bike group.
Estimated requirement:
Swim time: 9:10
Pace: 1:13 / 100 m
About 6.6 s faster in the swim
Maximum predicted gap after the swim: +13.4 s
The complete bike-group simulation, including catches and group mergers, is recalculated through the end of the bike split.
|
| 34 / 47 |
Juan Giraldo Gomez
COL
|
+35 s
+96 s
|
G2 / G5
|
16:37
16:17
|
42:11 | Show detailsPlacementPrediction: 34
80% range: 21–48
Top-10 probability: 1 %
Result: 47
Deviation: -13
SwimmingPrognoseabstand: +35 s
Time: 9:32
Pace: 1:16 / 100 m
Ergebnisabstand: +96 s
Fehler: -60.9 s
H2H: 39 Gegner:innen,
91 Duelle,
Korrektur 1.40 %,
Sicherheit 100 %
CyclingPrediction: Group 2 (23 people)
Gruppe 1: 5 %
Speed: 44.8 km/h
Initial Gruppe 4, später eingeholt/vereinigt
Gap ahead:
0.3 s
Gap behind:
0.1 s
Result: Group 5 (6 people)
Speed: 38.0 km/h
Tempo-Fehler: 6.74 km/h
Running and totalRun: 16:37 (3:19 / km)
Historical basis: 3:21 / km
Best comparable pace: 2:51 / km
Trend: +0:00 / km
Comparable races: 7
H2H: 36 Gegner:innen,
68 Duelle,
Korrektur -1.04 %,
Sicherheit 100 %
Ergebnis Lauf: 16:17 (3:15 / km)
Error: +0:20 / +0:04 / km
Overall prediction: 42:11
Data basis: 12 Races · Confidence 1.00
Swimming:
9:32
(1:16 / 100 m)
To the end of cycling (group time):
24:47
(44.8 km/h)
Run:
16:37
(3:19 / km)
Total:
42:11
Target first bike group at the bike finishGoal: finish the bike split with the first bike group.
Estimated requirement:
Swim time: 9:06
Pace: 1:13 / 100 m
About 26.2 s faster in the swim
Maximum predicted gap after the swim: +8.9 s
The complete bike-group simulation, including catches and group mergers, is recalculated through the end of the bike split.
|
| 35 / 33 |
 Matheus Oliveira Martinhaki
BRA
|
+39 s
+60 s
|
G2 / G2
correct
|
16:38
17:14
|
42:12 | Show detailsPlacementPrediction: 35
80% range: 10–51
Top-10 probability: 13 %
Result: 33
Deviation: 2
SwimmingPrognoseabstand: +39 s
Time: 9:36
Pace: 1:17 / 100 m
Ergebnisabstand: +60 s
Fehler: -20.9 s
H2H: 48 Gegner:innen,
182 Duelle,
Korrektur 0.07 %,
Sicherheit 100 %
CyclingPrediction: Group 2 (23 people)
Gruppe 1: 8 %
Speed: 44.8 km/h
Initial Gruppe 4, später eingeholt/vereinigt
Gap ahead:
0.4 s
Gap behind:
0.3 s
Result: Group 2 (29 people)
Speed: 41.2 km/h
Tempo-Fehler: 3.62 km/h
Running and totalRun: 16:38 (3:20 / km)
Historical basis: 3:23 / km
Best comparable pace: 3:07 / km
Trend: −0:04 / km
Comparable races: 9
H2H: 48 Gegner:innen,
181 Duelle,
Korrektur 0.23 %,
Sicherheit 100 %
Ergebnis Lauf: 17:14 (3:27 / km)
Error: −0:36 / −0:07 / km
Overall prediction: 42:12
Data basis: 12 Races · Confidence 1.00
Swimming:
9:36
(1:17 / 100 m)
To the end of cycling (group time):
24:47
(44.8 km/h)
Run:
16:38
(3:20 / km)
Total:
42:12
Target first bike group at the bike finishGoal: finish the bike split with the first bike group.
Estimated requirement:
Swim time: 9:06
Pace: 1:13 / 100 m
About 30.2 s faster in the swim
Maximum predicted gap after the swim: +8.9 s
The complete bike-group simulation, including catches and group mergers, is recalculated through the end of the bike split.
|
| 36 / 32 |
José Luis Zazueta Lizárraga
MEX
|
+37 s
+40 s
|
G2 / G2
correct
|
16:40
16:51
|
42:14 | Show detailsPlacementPrediction: 36
80% range: 10–52
Top-10 probability: 11 %
Result: 32
Deviation: 4
SwimmingPrognoseabstand: +37 s
Time: 9:34
Pace: 1:17 / 100 m
Ergebnisabstand: +40 s
Fehler: -3.1 s
H2H: 43 Gegner:innen,
78 Duelle,
Korrektur -0.16 %,
Sicherheit 100 %
CyclingPrediction: Group 2 (23 people)
Gruppe 1: 3 %
Speed: 44.8 km/h
Initial Gruppe 4, später eingeholt/vereinigt
Gap ahead:
0.0 s
Gap behind:
1.8 s
Result: Group 2 (29 people)
Speed: 40.9 km/h
Tempo-Fehler: 3.87 km/h
Running and totalRun: 16:40 (3:20 / km)
Historical basis: 3:24 / km
Best comparable pace: 3:00 / km
Trend: −0:04 / km
Comparable races: 5
H2H: 43 Gegner:innen,
78 Duelle,
Korrektur -0.30 %,
Sicherheit 100 %
Ergebnis Lauf: 16:51 (3:22 / km)
Error: −0:11 / −0:02 / km
Overall prediction: 42:14
Data basis: 6 Races · Confidence 1.00
Swimming:
9:34
(1:17 / 100 m)
To the end of cycling (group time):
24:47
(44.8 km/h)
Run:
16:40
(3:20 / km)
Total:
42:14
Target first bike group at the bike finishGoal: finish the bike split with the first bike group.
Estimated requirement:
Swim time: 9:29
Pace: 1:16 / 100 m
About 5.5 s faster in the swim
Maximum predicted gap after the swim: +31.4 s
The complete bike-group simulation, including catches and group mergers, is recalculated through the end of the bike split.
|
| 37 / 51 |
 Shavit Haiat
ISR
|
+45 s
+98 s
|
G2 / G5
|
16:40
16:58
|
42:14 | Show detailsPlacementPrediction: 37
80% range: 30–45
Top-10 probability: 0 %
Result: 51
Deviation: -14
SwimmingPrognoseabstand: +45 s
Time: 9:42
Pace: 1:18 / 100 m
Ergebnisabstand: +98 s
Fehler: -53.1 s
H2H: 41 Gegner:innen,
53 Duelle,
Korrektur 0.23 %,
Sicherheit 100 %
CyclingPrediction: Group 2 (23 people)
Gruppe 1: 0 %
Speed: 44.8 km/h
Initial Gruppe 4, später eingeholt/vereinigt
Gap ahead:
1.4 s
Gap behind:
0.4 s
Result: Group 5 (6 people)
Speed: 37.9 km/h
Tempo-Fehler: 6.83 km/h
Running and totalRun: 16:40 (3:20 / km)
Historical basis: 3:21 / km
Best comparable pace: 3:01 / km
Trend: +0:00 / km
Comparable races: 7
H2H: 41 Gegner:innen,
53 Duelle,
Korrektur -0.52 %,
Sicherheit 100 %
Ergebnis Lauf: 16:58 (3:24 / km)
Error: −0:18 / −0:04 / km
Overall prediction: 42:14
Data basis: 12 Races · Confidence 1.00
Swimming:
9:42
(1:18 / 100 m)
To the end of cycling (group time):
24:47
(44.8 km/h)
Run:
16:40
(3:20 / km)
Total:
42:14
Target first bike group at the bike finishGoal: finish the bike split with the first bike group.
Estimated requirement:
Swim time: 9:29
Pace: 1:16 / 100 m
About 13.5 s faster in the swim
Maximum predicted gap after the swim: +31.4 s
The complete bike-group simulation, including catches and group mergers, is recalculated through the end of the bike split.
|
| 38 / 31 |
Fabrizio Valentin Pavoni
ARG
|
+50 s
+54 s
|
G4 / G3
|
16:17
16:29
|
42:18 | Show detailsPlacementPrediction: 38
80% range: 10–54
Top-10 probability: 11 %
Result: 31
Deviation: 7
SwimmingPrognoseabstand: +50 s
Time: 9:47
Pace: 1:18 / 100 m
Ergebnisabstand: +54 s
Fehler: -4.2 s
H2H: 42 Gegner:innen,
82 Duelle,
Korrektur -0.24 %,
Sicherheit 100 %
CyclingPrediction: Group 4 (15 people)
Gruppe 1: 5 %
Speed: 44.4 km/h
Initial Gruppe 5, später eingeholt/vereinigt
Gap ahead:
1.3 s
Gap behind:
0.5 s
Result: Group 3 (5 people)
Speed: 40.5 km/h
Tempo-Fehler: 3.89 km/h
Running and totalRun: 16:17 (3:15 / km)
Historical basis: 3:19 / km
Best comparable pace: 2:57 / km
Trend: −0:04 / km
Comparable races: 7
H2H: 42 Gegner:innen,
83 Duelle,
Korrektur -0.11 %,
Sicherheit 100 %
Ergebnis Lauf: 16:29 (3:18 / km)
Error: −0:12 / −0:02 / km
Overall prediction: 42:18
Data basis: 9 Races · Confidence 1.00
Swimming:
9:47
(1:18 / 100 m)
To the end of cycling (group time):
25:01
(44.4 km/h)
Run:
16:17
(3:15 / km)
Total:
42:18
Target first bike group at the bike finishGoal: finish the bike split with the first bike group.
Estimated requirement:
Swim time: 9:06
Pace: 1:13 / 100 m
About 40.9 s faster in the swim
Maximum predicted gap after the swim: +8.9 s
The complete bike-group simulation, including catches and group mergers, is recalculated through the end of the bike split.
|
| 39 / 22 |
Benjamín Adriazola
CHI
|
+46 s
+33 s
|
G2 / G2
correct
|
16:44
16:07
|
42:18 | Show detailsPlacementPrediction: 39
80% range: 31–49
Top-10 probability: 0 %
Result: 22
Deviation: 17
SwimmingPrognoseabstand: +46 s
Time: 9:43
Pace: 1:18 / 100 m
Ergebnisabstand: +33 s
Fehler: 12.7 s
H2H: 47 Gegner:innen,
159 Duelle,
Korrektur -0.02 %,
Sicherheit 100 %
CyclingPrediction: Group 2 (23 people)
Gruppe 1: 3 %
Speed: 44.8 km/h
Initial Gruppe 4, später eingeholt/vereinigt
Gap ahead:
0.4 s
Gap behind:
0.5 s
Result: Group 2 (29 people)
Speed: 40.5 km/h
Tempo-Fehler: 4.24 km/h
Running and totalRun: 16:44 (3:21 / km)
Historical basis: 3:20 / km
Best comparable pace: 2:51 / km
Trend: +0:00 / km
Comparable races: 7
H2H: 47 Gegner:innen,
150 Duelle,
Korrektur 0.19 %,
Sicherheit 100 %
Ergebnis Lauf: 16:07 (3:13 / km)
Error: +0:37 / +0:07 / km
Overall prediction: 42:18
Data basis: 12 Races · Confidence 1.00
Swimming:
9:43
(1:18 / 100 m)
To the end of cycling (group time):
24:47
(44.8 km/h)
Run:
16:44
(3:21 / km)
Total:
42:18
Target first bike group at the bike finishGoal: finish the bike split with the first bike group.
Estimated requirement:
Swim time: 9:29
Pace: 1:16 / 100 m
About 14.3 s faster in the swim
Maximum predicted gap after the swim: +31.4 s
The complete bike-group simulation, including catches and group mergers, is recalculated through the end of the bike split.
|
| 40 / 24 |
Daniel Gossow
USA
|
+40 s
+80 s
|
G2 / G2
correct
|
16:48
16:09
|
42:22 | Show detailsPlacementPrediction: 40
80% range: 32–46
Top-10 probability: 0 %
Result: 24
Deviation: 16
SwimmingPrognoseabstand: +40 s
Time: 9:37
Pace: 1:17 / 100 m
Ergebnisabstand: +80 s
Fehler: -40.1 s
H2H: 16 Gegner:innen,
26 Duelle,
Korrektur 0.43 %,
Sicherheit 93 %
CyclingPrediction: Group 2 (23 people)
Gruppe 1: 4 %
Speed: 44.8 km/h
Initial Gruppe 4, später eingeholt/vereinigt
Gap ahead:
0.5 s
Gap behind:
0.1 s
Result: Group 2 (29 people)
Speed: 41.7 km/h
Tempo-Fehler: 3.10 km/h
Running and totalRun: 16:48 (3:22 / km)
Historical basis: 3:25 / km
Best comparable pace: 3:22 / km
Trend: −0:04 / km
Comparable races: 6
H2H: 17 Gegner:innen,
33 Duelle,
Korrektur 0.41 %,
Sicherheit 100 %
Ergebnis Lauf: 16:09 (3:14 / km)
Error: +0:39 / +0:08 / km
Overall prediction: 42:22
Data basis: 9 Races · Confidence 1.00
Swimming:
9:37
(1:17 / 100 m)
To the end of cycling (group time):
24:47
(44.8 km/h)
Run:
16:48
(3:22 / km)
Total:
42:22
Target first bike group at the bike finishGoal: finish the bike split with the first bike group.
Estimated requirement:
Swim time: 9:06
Pace: 1:13 / 100 m
About 31 s faster in the swim
Maximum predicted gap after the swim: +8.9 s
The complete bike-group simulation, including catches and group mergers, is recalculated through the end of the bike split.
|
| 41 / 26 |
Brett Saunders
CAN
|
+9 s
+42 s
|
G3 / G2
|
16:50
16:21
|
42:25 | Show detailsPlacementPrediction: 41
80% range: 13–48
Top-10 probability: 8 %
Result: 26
Deviation: 15
SwimmingPrognoseabstand: +9 s
Time: 9:06
Pace: 1:13 / 100 m
Ergebnisabstand: +42 s
Fehler: -32.6 s
H2H: 48 Gegner:innen,
106 Duelle,
Korrektur 0.54 %,
Sicherheit 100 %
CyclingPrediction: Group 3 (12 people)
Gruppe 1: 74 %
Speed: 44.3 km/h
Initial Gruppe 2, später eingeholt/vereinigt
Gap ahead:
4.4 s
Gap behind:
3.7 s
Result: Group 2 (29 people)
Speed: 40.7 km/h
Tempo-Fehler: 3.61 km/h
Running and totalRun: 16:50 (3:22 / km)
Historical basis: 3:27 / km
Best comparable pace: 3:03 / km
Trend: −0:04 / km
Comparable races: 11
H2H: 48 Gegner:innen,
107 Duelle,
Korrektur -0.42 %,
Sicherheit 100 %
Ergebnis Lauf: 16:21 (3:16 / km)
Error: +0:29 / +0:06 / km
Overall prediction: 42:25
Data basis: 12 Races · Confidence 1.00
Swimming:
9:06
(1:13 / 100 m)
To the end of cycling (group time):
25:04
(44.3 km/h)
Run:
16:50
(3:22 / km)
Total:
42:25
Target first bike group at the bike finishGoal: finish the bike split with the first bike group.
Estimated requirement:
Swim time: 9:06
Pace: 1:13 / 100 m
About 0.4 s faster in the swim
Maximum predicted gap after the swim: +9 s
The complete bike-group simulation, including catches and group mergers, is recalculated through the end of the bike split.
|
| 42 / 21 |
 Gabriel Lecheta
BRA
|
+75 s
+101 s
|
G5 / G2
|
14:28
15:54
|
42:27 | Show detailsPlacementPrediction: 42
80% range: 10–50
Top-10 probability: 13 %
Result: 21
Deviation: 21
SwimmingPrognoseabstand: +75 s
Time: 10:12
Pace: 1:22 / 100 m
Ergebnisabstand: +101 s
Fehler: -26.4 s
H2H: 47 Gegner:innen,
140 Duelle,
Korrektur -0.07 %,
Sicherheit 100 %
CyclingPrediction: Group 5 (6 people)
Gruppe 1: 0 %
Speed: 41.5 km/h
Initial Gruppe 6, später eingeholt/vereinigt
Gap ahead:
3.7 s
Gap behind:
0.9 s
Result: Group 2 (29 people)
Speed: 42.0 km/h
Tempo-Fehler: -0.49 km/h
Running and totalRun: 14:28 (2:54 / km)
Historical basis: 2:55 / km
Best comparable pace: 2:47 / km
Trend: −0:03 / km
Comparable races: 8
H2H: 47 Gegner:innen,
139 Duelle,
Korrektur 0.98 %,
Sicherheit 100 %
Ergebnis Lauf: 15:54 (3:11 / km)
Error: −1:26 / −0:17 / km
Overall prediction: 42:27
Data basis: 12 Races · Confidence 1.00
Swimming:
10:12
(1:22 / 100 m)
To the end of cycling (group time):
26:44
(41.5 km/h)
Run:
14:28
(2:54 / km)
Total:
42:27
Target first bike group at the bike finishGoal: finish the bike split with the first bike group.
Estimated requirement:
Swim time: 9:06
Pace: 1:13 / 100 m
About 65.7 s faster in the swim
Maximum predicted gap after the swim: +8.9 s
The complete bike-group simulation, including catches and group mergers, is recalculated through the end of the bike split.
|
| 43 / 42 |
 Bautista Arbizu
ARG
|
+56 s
+67 s
|
G4 / G3
|
16:43
18:22
|
42:44 | Show detailsPlacementPrediction: 43
80% range: 36–55
Top-10 probability: 0 %
Result: 42
Deviation: 1
SwimmingPrognoseabstand: +56 s
Time: 9:53
Pace: 1:19 / 100 m
Ergebnisabstand: +67 s
Fehler: -10.6 s
H2H: 32 Gegner:innen,
53 Duelle,
Korrektur -0.14 %,
Sicherheit 100 %
CyclingPrediction: Group 4 (15 people)
Gruppe 1: 0 %
Speed: 44.4 km/h
Initial Gruppe 5, später eingeholt/vereinigt
Gap ahead:
0.2 s
Gap behind:
3.5 s
Result: Group 3 (5 people)
Speed: 40.4 km/h
Tempo-Fehler: 3.94 km/h
Running and totalRun: 16:43 (3:21 / km)
Historical basis: 3:24 / km
Best comparable pace: 3:06 / km
Trend: −0:04 / km
Comparable races: 7
H2H: 34 Gegner:innen,
62 Duelle,
Korrektur 0.09 %,
Sicherheit 100 %
Ergebnis Lauf: 18:22 (3:40 / km)
Error: −1:39 / −0:20 / km
Overall prediction: 42:44
Data basis: 12 Races · Confidence 1.00
Swimming:
9:53
(1:19 / 100 m)
To the end of cycling (group time):
25:01
(44.4 km/h)
Run:
16:43
(3:21 / km)
Total:
42:44
Target first bike group at the bike finishGoal: finish the bike split with the first bike group.
Estimated requirement:
Swim time: 9:06
Pace: 1:13 / 100 m
About 47.5 s faster in the swim
Maximum predicted gap after the swim: +8.9 s
The complete bike-group simulation, including catches and group mergers, is recalculated through the end of the bike split.
|
| 44 / 20 |
 Carlos Javier Quinchara Forero
COL
|
+22 s
+35 s
|
G3 / G2
|
17:11
15:49
|
42:46 | Show detailsPlacementPrediction: 44
80% range: 38–47
Top-10 probability: 0 %
Result: 20
Deviation: 24
SwimmingPrognoseabstand: +22 s
Time: 9:19
Pace: 1:15 / 100 m
Ergebnisabstand: +35 s
Fehler: -12.6 s
H2H: 37 Gegner:innen,
133 Duelle,
Korrektur 0.05 %,
Sicherheit 100 %
CyclingPrediction: Group 3 (12 people)
Gruppe 1: 21 %
Speed: 44.3 km/h
Initial Gruppe 3, später eingeholt/vereinigt
Gap ahead:
0.5 s
Gap behind:
1.0 s
Result: Group 2 (29 people)
Speed: 40.7 km/h
Tempo-Fehler: 3.61 km/h
Running and totalRun: 17:11 (3:26 / km)
Historical basis: 3:28 / km
Best comparable pace: 3:06 / km
Trend: +0:00 / km
Comparable races: 5
H2H: 36 Gegner:innen,
124 Duelle,
Korrektur -1.00 %,
Sicherheit 100 %
Ergebnis Lauf: 15:49 (3:10 / km)
Error: +1:22 / +0:16 / km
Overall prediction: 42:46
Data basis: 12 Races · Confidence 1.00
Swimming:
9:19
(1:15 / 100 m)
To the end of cycling (group time):
25:04
(44.3 km/h)
Run:
17:11
(3:26 / km)
Total:
42:46
Target first bike group at the bike finishGoal: finish the bike split with the first bike group.
Estimated requirement:
Swim time: 9:06
Pace: 1:13 / 100 m
About 13.5 s faster in the swim
Maximum predicted gap after the swim: +8.9 s
The complete bike-group simulation, including catches and group mergers, is recalculated through the end of the bike split.
|
| 45 / 54 |
Oliver Larcombe
NZL
|
+22 s
+94 s
|
G3 / G4
|
17:11
18:17
|
42:46 | Show detailsPlacementPrediction: 45
80% range: 25–50
Top-10 probability: 0 %
Result: 54
Deviation: -9
SwimmingPrognoseabstand: +22 s
Time: 9:19
Pace: 1:15 / 100 m
Ergebnisabstand: +94 s
Fehler: -72.1 s
CyclingPrediction: Group 3 (12 people)
Gruppe 1: 33 %
Speed: 44.3 km/h
Initial Gruppe 3, später eingeholt/vereinigt
Gap ahead:
1.9 s
Gap behind:
0.5 s
Result: Group 4 (12 people)
Speed: 38.8 km/h
Tempo-Fehler: 5.51 km/h
Running and totalRun: 17:11 (3:26 / km)
Historical basis: 3:26 / km
Best comparable pace: 3:20 / km
Trend: +0:00 / km
Comparable races: 3
Ergebnis Lauf: 18:17 (3:39 / km)
Error: −1:06 / −0:13 / km
Overall prediction: 42:46
Data basis: 12 Races · Confidence 1.00
Swimming:
9:19
(1:15 / 100 m)
To the end of cycling (group time):
25:04
(44.3 km/h)
Run:
17:11
(3:26 / km)
Total:
42:46
Target first bike group at the bike finishGoal: finish the bike split with the first bike group.
Estimated requirement:
Swim time: 9:06
Pace: 1:13 / 100 m
About 13 s faster in the swim
Maximum predicted gap after the swim: +8.9 s
The complete bike-group simulation, including catches and group mergers, is recalculated through the end of the bike split.
|
| 46 / 2 |
Carter Stuhlmacher
USA
|
+3 s
+0 s
|
G1 / G1
correct
|
17:24
14:57
|
42:46 | Show detailsPlacementPrediction: 46
80% range: 22–53
Top-10 probability: 3 %
Result: 2
Deviation: 44
SwimmingPrognoseabstand: +3 s
Time: 9:00
Pace: 1:12 / 100 m
Ergebnisabstand: +0 s
Fehler: 3.1 s
H2H: 49 Gegner:innen,
127 Duelle,
Korrektur 0.13 %,
Sicherheit 100 %
CyclingPrediction: Group 1 (2 people)
Gruppe 1: 91 %
Speed: 43.9 km/h
Gap ahead:
–
Gap behind:
1.9 s
Result: Group 1 (6 people)
Speed: 40.6 km/h
Tempo-Fehler: 3.26 km/h
Running and totalRun: 17:24 (3:29 / km)
Historical basis: 3:35 / km
Best comparable pace: 2:55 / km
Trend: −0:04 / km
Comparable races: 8
H2H: 50 Gegner:innen,
119 Duelle,
Korrektur -1.46 %,
Sicherheit 100 %
Ergebnis Lauf: 14:57 (2:59 / km)
Error: +2:27 / +0:29 / km
Overall prediction: 42:46
Data basis: 12 Races · Confidence 1.00
Swimming:
9:00
(1:12 / 100 m)
To the end of cycling (group time):
25:17
(43.9 km/h)
Run:
17:24
(3:29 / km)
Total:
42:46
|
| 47 / 39 |
Cristopher Alexander Cardenas Jimenez
VEN
|
+32 s
+23 s
|
G2 / G2
correct
|
17:13
18:09
|
42:47 | Show detailsPlacementPrediction: 47
80% range: 39–49
Top-10 probability: 0 %
Result: 39
Deviation: 8
SwimmingPrognoseabstand: +32 s
Time: 9:29
Pace: 1:16 / 100 m
Ergebnisabstand: +23 s
Fehler: 9.4 s
H2H: 47 Gegner:innen,
111 Duelle,
Korrektur -0.59 %,
Sicherheit 100 %
CyclingPrediction: Group 2 (23 people)
Gruppe 1: 14 %
Speed: 44.8 km/h
Initial Gruppe 4, später eingeholt/vereinigt
Gap ahead:
0.9 s
Gap behind:
0.0 s
Result: Group 2 (29 people)
Speed: 40.2 km/h
Tempo-Fehler: 4.56 km/h
Running and totalRun: 17:13 (3:27 / km)
Historical basis: 3:29 / km
Best comparable pace: 3:27 / km
Trend: −0:04 / km
Comparable races: 8
H2H: 47 Gegner:innen,
104 Duelle,
Korrektur 0.89 %,
Sicherheit 100 %
Ergebnis Lauf: 18:09 (3:38 / km)
Error: −0:56 / −0:11 / km
Overall prediction: 42:47
Data basis: 12 Races · Confidence 1.00
Swimming:
9:29
(1:16 / 100 m)
To the end of cycling (group time):
24:47
(44.8 km/h)
Run:
17:13
(3:27 / km)
Total:
42:47
Target first bike group at the bike finishGoal: finish the bike split with the first bike group.
Estimated requirement:
Swim time: 9:06
Pace: 1:13 / 100 m
About 23.5 s faster in the swim
Maximum predicted gap after the swim: +8.9 s
The complete bike-group simulation, including catches and group mergers, is recalculated through the end of the bike split.
|
| 48 / 56 |
Jorge Raul Cabinal Gramajo
GUA
|
+45 s
+93 s
|
G2 / G4
|
17:14
18:41
|
42:48 | Show detailsPlacementPrediction: 48
80% range: 35–53
Top-10 probability: 1 %
Result: 56
Deviation: -8
SwimmingPrognoseabstand: +45 s
Time: 9:42
Pace: 1:18 / 100 m
Ergebnisabstand: +93 s
Fehler: -47.7 s
H2H: 37 Gegner:innen,
87 Duelle,
Korrektur 0.13 %,
Sicherheit 100 %
CyclingPrediction: Group 2 (23 people)
Gruppe 1: 0 %
Speed: 44.8 km/h
Initial Gruppe 4, später eingeholt/vereinigt
Gap ahead:
0.4 s
Gap behind:
0.4 s
Result: Group 4 (12 people)
Speed: 39.0 km/h
Tempo-Fehler: 5.78 km/h
Running and totalRun: 17:14 (3:27 / km)
Historical basis: 3:31 / km
Best comparable pace: 3:13 / km
Trend: −0:04 / km
Comparable races: 6
H2H: 37 Gegner:innen,
84 Duelle,
Korrektur -0.31 %,
Sicherheit 100 %
Ergebnis Lauf: 18:41 (3:44 / km)
Error: −1:27 / −0:17 / km
Overall prediction: 42:48
Data basis: 12 Races · Confidence 1.00
Swimming:
9:42
(1:18 / 100 m)
To the end of cycling (group time):
24:47
(44.8 km/h)
Run:
17:14
(3:27 / km)
Total:
42:48
Target first bike group at the bike finishGoal: finish the bike split with the first bike group.
Estimated requirement:
Swim time: 9:06
Pace: 1:13 / 100 m
About 36.4 s faster in the swim
Maximum predicted gap after the swim: +8.9 s
The complete bike-group simulation, including catches and group mergers, is recalculated through the end of the bike split.
|
| 49 / 53 |
 Arturo Salinas
PER
|
+56 s
+57 s
|
G4 / G5
|
16:55
17:14
|
42:56 | Show detailsPlacementPrediction: 49
80% range: 37–55
Top-10 probability: 0 %
Result: 53
Deviation: -4
SwimmingPrognoseabstand: +56 s
Time: 9:53
Pace: 1:19 / 100 m
Ergebnisabstand: +57 s
Fehler: -0.8 s
H2H: 44 Gegner:innen,
119 Duelle,
Korrektur -0.32 %,
Sicherheit 100 %
CyclingPrediction: Group 4 (15 people)
Gruppe 1: 0 %
Speed: 44.4 km/h
Initial Gruppe 5, später eingeholt/vereinigt
Gap ahead:
0.1 s
Gap behind:
0.2 s
Result: Group 5 (6 people)
Speed: 36.9 km/h
Tempo-Fehler: 7.52 km/h
Running and totalRun: 16:55 (3:23 / km)
Historical basis: 3:23 / km
Best comparable pace: 2:53 / km
Trend: +0:00 / km
Comparable races: 6
H2H: 44 Gegner:innen,
119 Duelle,
Korrektur 0.16 %,
Sicherheit 100 %
Ergebnis Lauf: 17:14 (3:27 / km)
Error: −0:19 / −0:04 / km
Overall prediction: 42:56
Data basis: 12 Races · Confidence 1.00
Swimming:
9:53
(1:19 / 100 m)
To the end of cycling (group time):
25:01
(44.4 km/h)
Run:
16:55
(3:23 / km)
Total:
42:56
Target first bike group at the bike finishGoal: finish the bike split with the first bike group.
Estimated requirement:
Swim time: 9:06
Pace: 1:13 / 100 m
About 47.3 s faster in the swim
Maximum predicted gap after the swim: +8.9 s
The complete bike-group simulation, including catches and group mergers, is recalculated through the end of the bike split.
|
| 50 / 37 |
Joao Victor Pereira
BRA
|
+66 s
+65 s
|
G5 / G2
|
15:33
17:57
|
43:32 | Show detailsPlacementPrediction: 50
80% range: 18–49
Top-10 probability: 1 %
Result: 37
Deviation: 13
SwimmingPrognoseabstand: +66 s
Time: 10:03
Pace: 1:20 / 100 m
Ergebnisabstand: +65 s
Fehler: 0.7 s
H2H: 43 Gegner:innen,
95 Duelle,
Korrektur -0.20 %,
Sicherheit 100 %
CyclingPrediction: Group 5 (6 people)
Gruppe 1: 0 %
Speed: 41.5 km/h
Initial Gruppe 6, später eingeholt/vereinigt
Gap ahead:
5.2 s
Gap behind:
2.7 s
Result: Group 2 (29 people)
Speed: 41.2 km/h
Tempo-Fehler: 0.36 km/h
Running and totalRun: 15:33 (3:07 / km)
Historical basis: 3:05 / km
Best comparable pace: 3:04 / km
Trend: +0:00 / km
Comparable races: 3
H2H: 43 Gegner:innen,
95 Duelle,
Korrektur 1.12 %,
Sicherheit 100 %
Ergebnis Lauf: 17:57 (3:35 / km)
Error: −2:24 / −0:29 / km
Overall prediction: 43:32
Data basis: 9 Races · Confidence 1.00
Swimming:
10:03
(1:20 / 100 m)
To the end of cycling (group time):
26:44
(41.5 km/h)
Run:
15:33
(3:07 / km)
Total:
43:32
Target first bike group at the bike finishGoal: finish the bike split with the first bike group.
Estimated requirement:
Swim time: 9:11
Pace: 1:13 / 100 m
About 52.3 s faster in the swim
Maximum predicted gap after the swim: +13.4 s
The complete bike-group simulation, including catches and group mergers, is recalculated through the end of the bike split.
|
| 51 / 40 |
Jael Juárez Moron
MEX
|
+60 s
+94 s
|
G4 / G3
|
17:32
18:19
|
43:33 | Show detailsPlacementPrediction: 51
80% range: 44–57
Top-10 probability: 0 %
Result: 40
Deviation: 11
SwimmingPrognoseabstand: +60 s
Time: 9:57
Pace: 1:20 / 100 m
Ergebnisabstand: +94 s
Fehler: -34.1 s
H2H: 25 Gegner:innen,
36 Duelle,
Korrektur -0.29 %,
Sicherheit 100 %
CyclingPrediction: Group 4 (15 people)
Gruppe 1: 0 %
Speed: 44.4 km/h
Initial Gruppe 5, später eingeholt/vereinigt
Gap ahead:
3.5 s
Gap behind:
0.6 s
Result: Group 3 (5 people)
Speed: 41.2 km/h
Tempo-Fehler: 3.13 km/h
Running and totalRun: 17:32 (3:30 / km)
Historical basis: 3:30 / km
Best comparable pace: 3:22 / km
Trend: +0:00 / km
Comparable races: 3
H2H: 25 Gegner:innen,
36 Duelle,
Korrektur -0.03 %,
Sicherheit 100 %
Ergebnis Lauf: 18:19 (3:40 / km)
Error: −0:47 / −0:09 / km
Overall prediction: 43:33
Data basis: 6 Races · Confidence 1.00
Swimming:
9:57
(1:20 / 100 m)
To the end of cycling (group time):
25:01
(44.4 km/h)
Run:
17:32
(3:30 / km)
Total:
43:33
Target first bike group at the bike finishGoal: finish the bike split with the first bike group.
Estimated requirement:
Swim time: 9:06
Pace: 1:13 / 100 m
About 51 s faster in the swim
Maximum predicted gap after the swim: +8.9 s
The complete bike-group simulation, including catches and group mergers, is recalculated through the end of the bike split.
|
| 52 / 34 |
Charlie Smoak
USA
|
+49 s
+95 s
|
G4 / G3
|
17:53
16:49
|
43:54 | Show detailsPlacementPrediction: 52
80% range: 49–55
Top-10 probability: 0 %
Result: 34
Deviation: 18
SwimmingPrognoseabstand: +49 s
Time: 9:46
Pace: 1:18 / 100 m
Ergebnisabstand: +95 s
Fehler: -46.5 s
H2H: 11 Gegner:innen,
11 Duelle,
Korrektur 0.63 %,
Sicherheit 54 %
CyclingPrediction: Group 4 (15 people)
Gruppe 1: 0 %
Speed: 44.4 km/h
Initial Gruppe 5, später eingeholt/vereinigt
Gap ahead:
0.3 s
Gap behind:
1.3 s
Result: Group 3 (5 people)
Speed: 41.2 km/h
Tempo-Fehler: 3.21 km/h
Running and totalRun: 17:53 (3:35 / km)
Historical basis: 3:36 / km
Best comparable pace: 3:24 / km
Trend: +0:00 / km
Comparable races: 2
H2H: 11 Gegner:innen,
11 Duelle,
Korrektur -0.70 %,
Sicherheit 54 %
Ergebnis Lauf: 16:49 (3:22 / km)
Error: +1:04 / +0:13 / km
Overall prediction: 43:54
Data basis: 2 Races · Confidence 0.40
Swimming:
9:46
(1:18 / 100 m)
To the end of cycling (group time):
25:01
(44.4 km/h)
Run:
17:53
(3:35 / km)
Total:
43:54
Target first bike group at the bike finishGoal: finish the bike split with the first bike group.
Estimated requirement:
Swim time: 9:06
Pace: 1:13 / 100 m
About 39.6 s faster in the swim
Maximum predicted gap after the swim: +8.9 s
The complete bike-group simulation, including catches and group mergers, is recalculated through the end of the bike split.
|
| 53 / 41 |
Brener Valencia Nuñez
PER
|
+68 s
+77 s
|
G5 / G4
|
16:05
16:46
|
44:04 | Show detailsPlacementPrediction: 53
80% range: 32–51
Top-10 probability: 0 %
Result: 41
Deviation: 12
SwimmingPrognoseabstand: +68 s
Time: 10:05
Pace: 1:21 / 100 m
Ergebnisabstand: +77 s
Fehler: -8.6 s
H2H: 45 Gegner:innen,
111 Duelle,
Korrektur -0.20 %,
Sicherheit 100 %
CyclingPrediction: Group 5 (6 people)
Gruppe 1: 0 %
Speed: 41.5 km/h
Initial Gruppe 6, später eingeholt/vereinigt
Gap ahead:
0.0 s
Gap behind:
2.5 s
Result: Group 4 (12 people)
Speed: 38.8 km/h
Tempo-Fehler: 2.74 km/h
Running and totalRun: 16:05 (3:13 / km)
Historical basis: 3:17 / km
Best comparable pace: 2:48 / km
Trend: −0:03 / km
Comparable races: 8
H2H: 45 Gegner:innen,
101 Duelle,
Korrektur -0.17 %,
Sicherheit 100 %
Ergebnis Lauf: 16:46 (3:21 / km)
Error: −0:41 / −0:08 / km
Overall prediction: 44:04
Data basis: 12 Races · Confidence 1.00
Swimming:
10:05
(1:21 / 100 m)
To the end of cycling (group time):
26:44
(41.5 km/h)
Run:
16:05
(3:13 / km)
Total:
44:04
Target first bike group at the bike finishGoal: finish the bike split with the first bike group.
Estimated requirement:
Swim time: 9:06
Pace: 1:13 / 100 m
About 59.5 s faster in the swim
Maximum predicted gap after the swim: +8.9 s
The complete bike-group simulation, including catches and group mergers, is recalculated through the end of the bike split.
|
| 54 / 48 |
 Jack Spence
RSA
|
+76 s
+97 s
|
G5 / G5
correct
|
16:32
16:18
|
44:31 | Show detailsPlacementPrediction: 54
80% range: 47–57
Top-10 probability: 0 %
Result: 48
Deviation: 6
SwimmingPrognoseabstand: +76 s
Time: 10:13
Pace: 1:22 / 100 m
Ergebnisabstand: +97 s
Fehler: -21.5 s
H2H: 11 Gegner:innen,
11 Duelle,
Korrektur 0.13 %,
Sicherheit 16 %
CyclingPrediction: Group 5 (6 people)
Gruppe 1: 0 %
Speed: 41.5 km/h
Initial Gruppe 6, später eingeholt/vereinigt
Gap ahead:
0.9 s
Gap behind:
9.1 s
Result: Group 5 (6 people)
Speed: 37.7 km/h
Tempo-Fehler: 3.83 km/h
Running and totalRun: 16:32 (3:18 / km)
Historical basis: 3:19 / km
Best comparable pace: 3:19 / km
Trend: +0:00 / km
Comparable races: 2
H2H: 13 Gegner:innen,
13 Duelle,
Korrektur -0.29 %,
Sicherheit 18 %
Ergebnis Lauf: 16:18 (3:16 / km)
Error: +0:14 / +0:03 / km
Overall prediction: 44:31
Data basis: 12 Races · Confidence 1.00
Swimming:
10:13
(1:22 / 100 m)
To the end of cycling (group time):
26:44
(41.5 km/h)
Run:
16:32
(3:18 / km)
Total:
44:31
Target first bike group at the bike finishGoal: finish the bike split with the first bike group.
Estimated requirement:
Swim time: 9:06
Pace: 1:13 / 100 m
About 66.6 s faster in the swim
Maximum predicted gap after the swim: +8.9 s
The complete bike-group simulation, including catches and group mergers, is recalculated through the end of the bike split.
|
| 55 / 55 |
Emiliano Saldaña Mercado
MEX
|
+56 s
+63 s
|
G4 / G5
|
18:32
17:46
|
44:33 | Show detailsPlacementPrediction: 55
80% range: 51–59
Top-10 probability: 0 %
Result: 55
Deviation: 0
SwimmingPrognoseabstand: +56 s
Time: 9:53
Pace: 1:19 / 100 m
Ergebnisabstand: +63 s
Fehler: -6.9 s
H2H: 13 Gegner:innen,
13 Duelle,
Korrektur -0.18 %,
Sicherheit 67 %
CyclingPrediction: Group 4 (15 people)
Gruppe 1: 3 %
Speed: 44.4 km/h
Initial Gruppe 5, später eingeholt/vereinigt
Gap ahead:
3.9 s
Gap behind:
0.1 s
Result: Group 5 (6 people)
Speed: 37.2 km/h
Tempo-Fehler: 7.19 km/h
Running and totalRun: 18:32 (3:42 / km)
Historical basis: 3:44 / km
Best comparable pace: 3:11 / km
Trend: +0:00 / km
Comparable races: 3
H2H: 13 Gegner:innen,
13 Duelle,
Korrektur -0.55 %,
Sicherheit 67 %
Ergebnis Lauf: 17:46 (3:33 / km)
Error: +0:46 / +0:09 / km
Overall prediction: 44:33
Data basis: 4 Races · Confidence 0.80
Swimming:
9:53
(1:19 / 100 m)
To the end of cycling (group time):
25:01
(44.4 km/h)
Run:
18:32
(3:42 / km)
Total:
44:33
Target first bike group at the bike finishGoal: finish the bike split with the first bike group.
Estimated requirement:
Swim time: 9:06
Pace: 1:13 / 100 m
About 47.2 s faster in the swim
Maximum predicted gap after the swim: +8.9 s
The complete bike-group simulation, including catches and group mergers, is recalculated through the end of the bike split.
|
| 56 / 57 |
João Vitor Mazorca
BRA
|
+37 s
+56 s
|
G2 / G4
|
19:20
18:40
|
44:54 | Show detailsPlacementPrediction: 56
80% range: 53–59
Top-10 probability: 0 %
Result: 57
Deviation: -1
SwimmingPrognoseabstand: +37 s
Time: 9:34
Pace: 1:17 / 100 m
Ergebnisabstand: +56 s
Fehler: -19.1 s
H2H: 45 Gegner:innen,
100 Duelle,
Korrektur 0.39 %,
Sicherheit 100 %
CyclingPrediction: Group 2 (23 people)
Gruppe 1: 11 %
Speed: 44.8 km/h
Initial Gruppe 4, später eingeholt/vereinigt
Gap ahead:
0.6 s
Gap behind:
0.0 s
Result: Group 4 (12 people)
Speed: 38.0 km/h
Tempo-Fehler: 6.81 km/h
Running and totalRun: 19:20 (3:52 / km)
Historical basis: 3:50 / km
Best comparable pace: 3:09 / km
Trend: +0:00 / km
Comparable races: 9
H2H: 45 Gegner:innen,
102 Duelle,
Korrektur 0.75 %,
Sicherheit 100 %
Ergebnis Lauf: 18:40 (3:44 / km)
Error: +0:40 / +0:08 / km
Overall prediction: 44:54
Data basis: 11 Races · Confidence 1.00
Swimming:
9:34
(1:17 / 100 m)
To the end of cycling (group time):
24:47
(44.8 km/h)
Run:
19:20
(3:52 / km)
Total:
44:54
Target first bike group at the bike finishGoal: finish the bike split with the first bike group.
Estimated requirement:
Swim time: 9:06
Pace: 1:13 / 100 m
About 28 s faster in the swim
Maximum predicted gap after the swim: +8.9 s
The complete bike-group simulation, including catches and group mergers, is recalculated through the end of the bike split.
|
| 57 / 60 |
Gian Franco Mario Farnetano
VEN
|
+97 s
+98 s
|
G6 / G6
correct
|
15:52
18:08
|
45:33 | Show detailsPlacementPrediction: 57
80% range: 48–59
Top-10 probability: 0 %
Result: 60
Deviation: -3
SwimmingPrognoseabstand: +97 s
Time: 10:34
Pace: 1:25 / 100 m
Ergebnisabstand: +98 s
Fehler: -0.6 s
H2H: 40 Gegner:innen,
62 Duelle,
Korrektur -0.22 %,
Sicherheit 100 %
CyclingPrediction: Group 6 (5 people)
Gruppe 1: 0 %
Speed: 39.9 km/h
Initial Gruppe 8, später eingeholt/vereinigt
Gap ahead:
11.4 s
Gap behind:
3.3 s
Result: Group 6 (5 people)
Speed: 35.9 km/h
Tempo-Fehler: 3.92 km/h
Running and totalRun: 15:52 (3:10 / km)
Historical basis: 3:09 / km
Best comparable pace: 3:09 / km
Trend: +0:00 / km
Comparable races: 2
H2H: 38 Gegner:innen,
47 Duelle,
Korrektur 0.96 %,
Sicherheit 100 %
Ergebnis Lauf: 18:08 (3:38 / km)
Error: −2:16 / −0:27 / km
Overall prediction: 45:33
Data basis: 10 Races · Confidence 1.00
Swimming:
10:34
(1:25 / 100 m)
To the end of cycling (group time):
27:58
(39.9 km/h)
Run:
15:52
(3:10 / km)
Total:
45:33
Target first bike group at the bike finishGoal: finish the bike split with the first bike group.
Estimated requirement:
Swim time: 9:06
Pace: 1:13 / 100 m
About 88.5 s faster in the swim
Maximum predicted gap after the swim: +8.9 s
The complete bike-group simulation, including catches and group mergers, is recalculated through the end of the bike split.
|
| 58 / 44 |
Ignacio Ernesto Braga Giménez
ARG
|
+71 s
+92 s
|
G5 / G4
|
18:11
16:56
|
46:10 | Show detailsPlacementPrediction: 58
80% range: 55–59
Top-10 probability: 0 %
Result: 44
Deviation: 14
SwimmingPrognoseabstand: +71 s
Time: 10:08
Pace: 1:21 / 100 m
Ergebnisabstand: +92 s
Fehler: -21.1 s
H2H: 8 Gegner:innen,
12 Duelle,
Korrektur -0.89 %,
Sicherheit 43 %
CyclingPrediction: Group 5 (6 people)
Gruppe 1: 0 %
Speed: 41.5 km/h
Initial Gruppe 6, später eingeholt/vereinigt
Gap ahead:
2.5 s
Gap behind:
3.7 s
Result: Group 4 (12 people)
Speed: 38.8 km/h
Tempo-Fehler: 2.76 km/h
Running and totalRun: 18:11 (3:38 / km)
Historical basis: 3:41 / km
Best comparable pace: 3:41 / km
Trend: +0:00 / km
Comparable races: 1
H2H: 8 Gegner:innen,
12 Duelle,
Korrektur -1.48 %,
Sicherheit 39 %
Ergebnis Lauf: 16:56 (3:23 / km)
Error: +1:15 / +0:15 / km
Overall prediction: 46:10
Data basis: 3 Races · Confidence 0.60
Swimming:
10:08
(1:21 / 100 m)
To the end of cycling (group time):
26:44
(41.5 km/h)
Run:
18:11
(3:38 / km)
Total:
46:10
Target first bike group at the bike finishGoal: finish the bike split with the first bike group.
Estimated requirement:
Swim time: 9:06
Pace: 1:13 / 100 m
About 62 s faster in the swim
Maximum predicted gap after the swim: +8.9 s
The complete bike-group simulation, including catches and group mergers, is recalculated through the end of the bike split.
|
| 59 / 49 |
Matias Bellido
ARG
|
+101 s
+91 s
|
G6 / G4
|
18:01
17:20
|
47:42 | Show detailsPlacementPrediction: 59
80% range: 60–62
Top-10 probability: 0 %
Result: 49
Deviation: 10
SwimmingPrognoseabstand: +101 s
Time: 10:38
Pace: 1:25 / 100 m
Ergebnisabstand: +91 s
Fehler: 9.7 s
H2H: 12 Gegner:innen,
22 Duelle,
Korrektur -0.43 %,
Sicherheit 76 %
CyclingPrediction: Group 6 (5 people)
Gruppe 1: 0 %
Speed: 39.9 km/h
Initial Gruppe 8, später eingeholt/vereinigt
Gap ahead:
3.3 s
Gap behind:
2.4 s
Result: Group 4 (12 people)
Speed: 38.7 km/h
Tempo-Fehler: 1.12 km/h
Running and totalRun: 18:01 (3:36 / km)
Historical basis: 3:38 / km
Best comparable pace: 3:38 / km
Trend: +0:00 / km
Comparable races: 2
H2H: 12 Gegner:innen,
22 Duelle,
Korrektur -0.62 %,
Sicherheit 58 %
Ergebnis Lauf: 17:20 (3:28 / km)
Error: +0:41 / +0:08 / km
Overall prediction: 47:42
Data basis: 4 Races · Confidence 0.80
Swimming:
10:38
(1:25 / 100 m)
To the end of cycling (group time):
27:58
(39.9 km/h)
Run:
18:01
(3:36 / km)
Total:
47:42
Target first bike group at the bike finishGoal: finish the bike split with the first bike group.
Estimated requirement:
Swim time: 9:06
Pace: 1:13 / 100 m
About 91.8 s faster in the swim
Maximum predicted gap after the swim: +8.9 s
The complete bike-group simulation, including catches and group mergers, is recalculated through the end of the bike split.
|
| 60 / 58 |
 Rey Vélez
PUR
|
+103 s
+100 s
|
G6 / G5
|
19:03
18:05
|
48:44 | Show detailsPlacementPrediction: 60
80% range: 61–63
Top-10 probability: 0 %
Result: 58
Deviation: 2
SwimmingPrognoseabstand: +103 s
Time: 10:40
Pace: 1:25 / 100 m
Ergebnisabstand: +100 s
Fehler: 3.1 s
H2H: 46 Gegner:innen,
74 Duelle,
Korrektur 0.32 %,
Sicherheit 100 %
CyclingPrediction: Group 6 (5 people)
Gruppe 1: 0 %
Speed: 39.9 km/h
Initial Gruppe 8, später eingeholt/vereinigt
Gap ahead:
2.4 s
Gap behind:
–
Result: Group 5 (6 people)
Speed: 37.9 km/h
Tempo-Fehler: 1.98 km/h
Running and totalRun: 19:03 (3:49 / km)
Historical basis: 3:55 / km
Best comparable pace: 3:26 / km
Trend: −0:04 / km
Comparable races: 7
H2H: 46 Gegner:innen,
74 Duelle,
Korrektur -0.80 %,
Sicherheit 100 %
Ergebnis Lauf: 18:05 (3:37 / km)
Error: +0:58 / +0:12 / km
Overall prediction: 48:44
Data basis: 12 Races · Confidence 1.00
Swimming:
10:40
(1:25 / 100 m)
To the end of cycling (group time):
27:58
(39.9 km/h)
Run:
19:03
(3:49 / km)
Total:
48:44
Target first bike group at the bike finishGoal: finish the bike split with the first bike group.
Estimated requirement:
Swim time: 9:06
Pace: 1:13 / 100 m
About 94.2 s faster in the swim
Maximum predicted gap after the swim: +8.9 s
The complete bike-group simulation, including catches and group mergers, is recalculated through the end of the bike split.
|
| 61 / 63 |
Benjamín Daniel Diaz-Valdes Escobar
CHI
|
+86 s
+82 s
|
G6 / G6
correct
|
19:05
20:50
|
48:46 | Show detailsPlacementPrediction: 61
80% range: 60–62
Top-10 probability: 0 %
Result: 63
Deviation: -2
SwimmingPrognoseabstand: +86 s
Time: 10:23
Pace: 1:23 / 100 m
Ergebnisabstand: +82 s
Fehler: 4.0 s
H2H: 2 Gegner:innen,
2 Duelle,
Korrektur 0.26 %,
Sicherheit 15 %
CyclingPrediction: Group 6 (5 people)
Gruppe 1: 0 %
Speed: 39.9 km/h
Initial Gruppe 7, später eingeholt/vereinigt
Gap ahead:
1.4 s
Gap behind:
11.4 s
Result: Group 6 (5 people)
Speed: 35.7 km/h
Tempo-Fehler: 4.21 km/h
Running and totalRun: 19:05 (3:49 / km)
Historical basis: 3:46 / km
Best comparable pace: 3:46 / km
Trend: +0:00 / km
Comparable races: 1
H2H: 2 Gegner:innen,
2 Duelle,
Korrektur 1.18 %,
Sicherheit 15 %
Ergebnis Lauf: 20:50 (4:10 / km)
Error: −1:45 / −0:21 / km
Overall prediction: 48:46
Data basis: 2 Races · Confidence 0.40
Swimming:
10:23
(1:23 / 100 m)
To the end of cycling (group time):
27:58
(39.9 km/h)
Run:
19:05
(3:49 / km)
Total:
48:46
Target first bike group at the bike finishGoal: finish the bike split with the first bike group.
Estimated requirement:
Swim time: 9:06
Pace: 1:13 / 100 m
About 77.1 s faster in the swim
Maximum predicted gap after the swim: +8.9 s
The complete bike-group simulation, including catches and group mergers, is recalculated through the end of the bike split.
|
| 62 / 61 |
Benjamin Ignacio Parada Segura
CHI
|
+85 s
+99 s
|
G6 / G6
correct
|
19:48
19:38
|
49:29 | Show detailsPlacementPrediction: 62
80% range: 59–63
Top-10 probability: 0 %
Result: 61
Deviation: 1
SwimmingPrognoseabstand: +85 s
Time: 10:22
Pace: 1:23 / 100 m
Ergebnisabstand: +99 s
Fehler: -14.4 s
H2H: 45 Gegner:innen,
110 Duelle,
Korrektur 1.06 %,
Sicherheit 100 %
CyclingPrediction: Group 6 (5 people)
Gruppe 1: 0 %
Speed: 39.9 km/h
Initial Gruppe 7, später eingeholt/vereinigt
Gap ahead:
9.1 s
Gap behind:
1.4 s
Result: Group 6 (5 people)
Speed: 36.2 km/h
Tempo-Fehler: 3.63 km/h
Running and totalRun: 19:48 (3:58 / km)
Historical basis: 4:02 / km
Best comparable pace: 3:37 / km
Trend: −0:04 / km
Comparable races: 6
H2H: 47 Gegner:innen,
122 Duelle,
Korrektur -0.18 %,
Sicherheit 100 %
Ergebnis Lauf: 19:38 (3:56 / km)
Error: +0:10 / +0:02 / km
Overall prediction: 49:29
Data basis: 11 Races · Confidence 1.00
Swimming:
10:22
(1:23 / 100 m)
To the end of cycling (group time):
27:58
(39.9 km/h)
Run:
19:48
(3:58 / km)
Total:
49:29
Target first bike group at the bike finishGoal: finish the bike split with the first bike group.
Estimated requirement:
Swim time: 9:06
Pace: 1:13 / 100 m
About 75.7 s faster in the swim
Maximum predicted gap after the swim: +8.9 s
The complete bike-group simulation, including catches and group mergers, is recalculated through the end of the bike split.
|
| 0 / 62 |
Alexandre Cesar Borges Da Nobrega
BRA
|
+52 s
+104 s
|
G4 / G6
|
20:08
|
Show detailsPlacementPrediction: 0
80% range: 1–1
Top-10 probability: 100 %
Result: 62
Deviation: -62
SwimmingPrognoseabstand: +52 s
Time: 9:49
Pace: 1:19 / 100 m
Ergebnisabstand: +104 s
Fehler: -52.0 s
CyclingPrediction: Group 4 (15 people)
Gruppe 1: 0 %
Speed: 44.4 km/h
Initial Gruppe 5, später eingeholt/vereinigt
Gap ahead:
0.3 s
Gap behind:
0.2 s
Result: Group 6 (5 people)
Speed: 36.4 km/h
Tempo-Fehler: 8.02 km/h
Running and totalRun: ()
Historical basis:
Best comparable pace:
Trend: +0:00 / km
Comparable races: 0
Fallback calculation from other run distances
Ergebnis Lauf: 20:08 (4:02 / km)
Error: /
Overall prediction:
Data basis: 1 Races · Confidence 0.20
Swimming:
9:49
(1:19 / 100 m)
To the end of cycling (group time):
25:01
(44.4 km/h)
Run:
–
Total:
not fully calculable
Target first bike group at the bike finishGoal: finish the bike split with the first bike group.
Estimated requirement:
Swim time: 9:06
Pace: 1:13 / 100 m
About 43.1 s faster in the swim
Maximum predicted gap after the swim: +8.9 s
The complete bike-group simulation, including catches and group mergers, is recalculated through the end of the bike split.
|