Junior Men
Race information and calculation basis
Datengrundlage: maximal zwölf Starts je Athlet:in, die zeitlich strikt vor 04.07.2026 liegen. Neuere Leistungen und direkte Duelle werden mit einer Halbwertszeit von 300 Tagen stärker gewichtet.
Show model parameters and data quality
Kalibriert mit 35 früheren Rennen und 753 Athlet:innen. Paarweise Gruppengüte: 47.1 %.
Trainingsdaten ausschließlich vor 04.07.2026.
Datenabdeckung 45.3 % · Head-to-Head-Abdeckung 84.9 % · 35 Kalibrierungsrennen
Show methodology
Only after the historical calculation is the prediction compared with the actual result.
Prediction comparison
Summary of prediction errors
| Place Prediction / result |
Athlete | Swimming Prediction / result |
Bike group Prediction / result |
Run Prediction / result |
Overall prediction | Details |
|---|---|---|---|---|---|---|
| 1 / 3 |
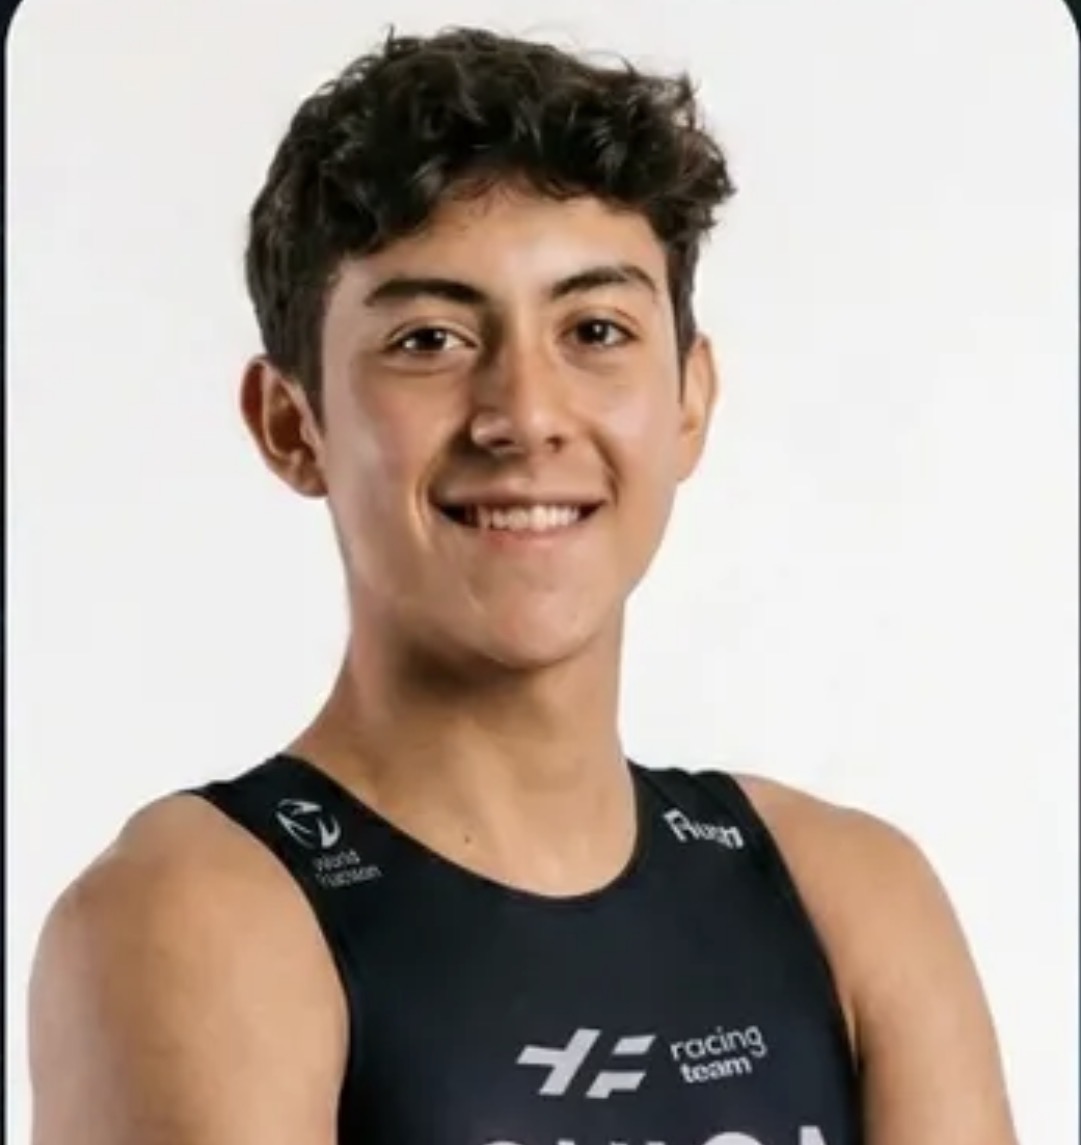 Thomas Francisco Chica Perez
ECU
|
+29 s
+30 s
|
G2 / G1
|
14:17
15:23
|
45:08 | Show detailsPlacementPrediction: 1
80% range: 11–12
Top-10 probability: 4 %
Result: 3
Deviation: -2
SwimmingPrognoseabstand: +29 s
Time: 9:45
Pace: 1:18 / 100 m
Ergebnisabstand: +30 s
Fehler: -1.2 s
H2H: 22 Gegner:innen,
43 Duelle,
Korrektur -0.26 %,
Sicherheit 100 %
CyclingPrediction: Group 2 (38 people)
Gruppe 1: 45 %
Speed: 43.3 km/h
Initial Gruppe 3, später eingeholt/vereinigt
Gap ahead:
3.1 s
Gap behind:
1.1 s
Result: Group 1 (18 people)
Speed: 44.0 km/h
Tempo-Fehler: -0.66 km/h
Running and totalRun: 14:17 (2:51 / km)
Historical basis: 2:52 / km
Best comparable pace: 2:51 / km
Trend: −0:03 / km
Comparable races: 5
H2H: 20 Gegner:innen,
34 Duelle,
Korrektur 1.72 %,
Sicherheit 81 %
Ergebnis Lauf: 15:23 (3:05 / km)
Error: −1:06 / −0:13 / km
Overall prediction: 45:08
Data basis: 12 Races · Confidence 1.00
Swimming:
9:45
(1:18 / 100 m)
To the end of cycling (group time):
29:49
(43.3 km/h)
Run:
14:17
(2:51 / km)
Total:
45:08
Target first bike group at the bike finishGoal: finish the bike split with the first bike group.
Estimated requirement:
Swim time: 9:29
Pace: 1:16 / 100 m
About 15.9 s faster in the swim
Maximum predicted gap after the swim: +12.9 s
The complete bike-group simulation, including catches and group mergers, is recalculated through the end of the bike split.
|
| 2 / 22 |
 Jesus Daniel Hernández Bobadilla
MEX
|
+54 s
+31 s
|
G2 / G2
correct
|
15:40
16:11
|
46:31 | Show detailsPlacementPrediction: 2
80% range: 12–29
Top-10 probability: 0 %
Result: 22
Deviation: -20
SwimmingPrognoseabstand: +54 s
Time: 10:10
Pace: 1:21 / 100 m
Ergebnisabstand: +31 s
Fehler: 22.6 s
H2H: 19 Gegner:innen,
26 Duelle,
Korrektur -0.30 %,
Sicherheit 65 %
CyclingPrediction: Group 2 (38 people)
Gruppe 1: 18 %
Speed: 43.3 km/h
Initial Gruppe 4, später eingeholt/vereinigt
Gap ahead:
0.3 s
Gap behind:
1.5 s
Result: Group 2 (29 people)
Speed: 41.6 km/h
Tempo-Fehler: 1.79 km/h
Running and totalRun: 15:40 (3:08 / km)
Historical basis: 3:12 / km
Best comparable pace: 3:04 / km
Trend: −0:04 / km
Comparable races: 6
H2H: 19 Gegner:innen,
26 Duelle,
Korrektur -0.05 %,
Sicherheit 66 %
Ergebnis Lauf: 16:11 (3:14 / km)
Error: −0:31 / −0:06 / km
Overall prediction: 46:31
Data basis: 10 Races · Confidence 1.00
Swimming:
10:10
(1:21 / 100 m)
To the end of cycling (group time):
29:49
(43.3 km/h)
Run:
15:40
(3:08 / km)
Total:
46:31
Target first bike group at the bike finish
Cannot be calculated without a swim distance or historical swim data.
|
| 3 / 18 |
Alessandro Diego Cortez Delgado
MEX
|
+8 s
+26 s
|
G1 / G2
|
15:55
15:28
|
46:38 | Show detailsPlacementPrediction: 3
80% range: 12–16
Top-10 probability: 0 %
Result: 18
Deviation: -15
SwimmingPrognoseabstand: +8 s
Time: 9:24
Pace: 1:15 / 100 m
Ergebnisabstand: +26 s
Fehler: -18.4 s
H2H: 5 Gegner:innen,
7 Duelle,
Korrektur 0.44 %,
Sicherheit 34 %
CyclingPrediction: Group 1 (2 people)
Gruppe 1: 91 %
Speed: 42.4 km/h
Initial Gruppe 2, später eingeholt/vereinigt
Gap ahead:
7.6 s
Gap behind:
10.4 s
Result: Group 2 (29 people)
Speed: 41.4 km/h
Tempo-Fehler: 0.95 km/h
Running and totalRun: 15:55 (3:11 / km)
Historical basis: 3:10 / km
Best comparable pace: 3:10 / km
Trend: +0:00 / km
Comparable races: 2
H2H: 5 Gegner:innen,
7 Duelle,
Korrektur 0.31 %,
Sicherheit 23 %
Ergebnis Lauf: 15:28 (3:06 / km)
Error: +0:27 / +0:05 / km
Overall prediction: 46:38
Data basis: 4 Races · Confidence 0.80
Swimming:
9:24
(1:15 / 100 m)
To the end of cycling (group time):
30:36
(42.4 km/h)
Run:
15:55
(3:11 / km)
Total:
46:38
|
| 4 / 1 |
Robi Racine
CAN
|
+37 s
+13 s
|
G2 / G1
|
15:50
15:18
|
46:41 | Show detailsPlacementPrediction: 4
80% range: 12–22
Top-10 probability: 0 %
Result: 1
Deviation: 3
SwimmingPrognoseabstand: +37 s
Time: 9:53
Pace: 1:19 / 100 m
Ergebnisabstand: +13 s
Fehler: 23.9 s
H2H: 16 Gegner:innen,
18 Duelle,
Korrektur 0.66 %,
Sicherheit 63 %
CyclingPrediction: Group 2 (38 people)
Gruppe 1: 43 %
Speed: 43.3 km/h
Initial Gruppe 3, später eingeholt/vereinigt
Gap ahead:
2.4 s
Gap behind:
0.1 s
Result: Group 1 (18 people)
Speed: 43.4 km/h
Tempo-Fehler: -0.09 km/h
Running and totalRun: 15:50 (3:10 / km)
Historical basis: 3:13 / km
Best comparable pace: 3:08 / km
Trend: −0:04 / km
Comparable races: 5
H2H: 16 Gegner:innen,
19 Duelle,
Korrektur 0.59 %,
Sicherheit 59 %
Ergebnis Lauf: 15:18 (3:04 / km)
Error: +0:32 / +0:06 / km
Overall prediction: 46:41
Data basis: 7 Races · Confidence 1.00
Swimming:
9:53
(1:19 / 100 m)
To the end of cycling (group time):
29:49
(43.3 km/h)
Run:
15:50
(3:10 / km)
Total:
46:41
Target first bike group at the bike finishGoal: finish the bike split with the first bike group.
Estimated requirement:
Swim time: 9:29
Pace: 1:16 / 100 m
About 24 s faster in the swim
Maximum predicted gap after the swim: +12.9 s
The complete bike-group simulation, including catches and group mergers, is recalculated through the end of the bike split.
|
| 5 / 9 |
Matteo Somma
USA
|
+48 s
+25 s
|
G2 / G1
|
16:13
15:56
|
47:04 | Show detailsPlacementPrediction: 5
80% range: 14–25
Top-10 probability: 0 %
Result: 9
Deviation: -4
SwimmingPrognoseabstand: +48 s
Time: 10:04
Pace: 1:21 / 100 m
Ergebnisabstand: +25 s
Fehler: 22.9 s
H2H: 21 Gegner:innen,
25 Duelle,
Korrektur 0.06 %,
Sicherheit 79 %
CyclingPrediction: Group 2 (38 people)
Gruppe 1: 26 %
Speed: 43.3 km/h
Initial Gruppe 4, später eingeholt/vereinigt
Gap ahead:
0.1 s
Gap behind:
2.4 s
Result: Group 1 (18 people)
Speed: 43.8 km/h
Tempo-Fehler: -0.41 km/h
Running and totalRun: 16:13 (3:15 / km)
Historical basis: 3:14 / km
Best comparable pace: 3:14 / km
Trend: +0:00 / km
Comparable races: 4
H2H: 21 Gegner:innen,
25 Duelle,
Korrektur 0.36 %,
Sicherheit 73 %
Ergebnis Lauf: 15:56 (3:11 / km)
Error: +0:17 / +0:03 / km
Overall prediction: 47:04
Data basis: 5 Races · Confidence 1.00
Swimming:
10:04
(1:21 / 100 m)
To the end of cycling (group time):
29:49
(43.3 km/h)
Run:
16:13
(3:15 / km)
Total:
47:04
Target first bike group at the bike finishGoal: finish the bike split with the first bike group.
Estimated requirement:
Swim time: 9:29
Pace: 1:16 / 100 m
About 35.4 s faster in the swim
Maximum predicted gap after the swim: +12.5 s
The complete bike-group simulation, including catches and group mergers, is recalculated through the end of the bike split.
|
| 6 / 26 |
Gerald Rojas Carvajal
CRC
|
+35 s
+48 s
|
G2 / G2
correct
|
16:14
16:10
|
47:05 | Show detailsPlacementPrediction: 6
80% range: 12–27
Top-10 probability: 1 %
Result: 26
Deviation: -20
SwimmingPrognoseabstand: +35 s
Time: 9:51
Pace: 1:19 / 100 m
Ergebnisabstand: +48 s
Fehler: -13.5 s
H2H: 25 Gegner:innen,
36 Duelle,
Korrektur -0.34 %,
Sicherheit 100 %
CyclingPrediction: Group 2 (38 people)
Gruppe 1: 36 %
Speed: 43.3 km/h
Initial Gruppe 3, später eingeholt/vereinigt
Gap ahead:
0.6 s
Gap behind:
2.4 s
Result: Group 2 (29 people)
Speed: 41.9 km/h
Tempo-Fehler: 1.50 km/h
Running and totalRun: 16:14 (3:15 / km)
Historical basis: 3:14 / km
Best comparable pace: 2:57 / km
Trend: +0:00 / km
Comparable races: 3
H2H: 23 Gegner:innen,
32 Duelle,
Korrektur 0.18 %,
Sicherheit 98 %
Ergebnis Lauf: 16:10 (3:14 / km)
Error: +0:04 / +0:01 / km
Overall prediction: 47:05
Data basis: 12 Races · Confidence 1.00
Swimming:
9:51
(1:19 / 100 m)
To the end of cycling (group time):
29:49
(43.3 km/h)
Run:
16:14
(3:15 / km)
Total:
47:05
Target first bike group at the bike finishGoal: finish the bike split with the first bike group.
Estimated requirement:
Swim time: 9:29
Pace: 1:16 / 100 m
About 22 s faster in the swim
Maximum predicted gap after the swim: +12.5 s
The complete bike-group simulation, including catches and group mergers, is recalculated through the end of the bike split.
|
| 7 / 5 |
Pablo Joel Calderon Garcia
MEX
|
+20 s
+16 s
|
G2 / G1
|
16:24
15:41
|
47:15 | Show detailsPlacementPrediction: 7
80% range: 15–21
Top-10 probability: 0 %
Result: 5
Deviation: 2
SwimmingPrognoseabstand: +20 s
Time: 9:36
Pace: 1:17 / 100 m
Ergebnisabstand: +16 s
Fehler: 4.1 s
H2H: 8 Gegner:innen,
13 Duelle,
Korrektur 0.08 %,
Sicherheit 14 %
CyclingPrediction: Group 2 (38 people)
Gruppe 1: 51 %
Speed: 43.3 km/h
Initial Gruppe 3, später eingeholt/vereinigt
Gap ahead:
2.1 s
Gap behind:
2.0 s
Result: Group 1 (18 people)
Speed: 43.6 km/h
Tempo-Fehler: -0.26 km/h
Running and totalRun: 16:24 (3:17 / km)
Historical basis: 3:17 / km
Best comparable pace: 3:17 / km
Trend: +0:00 / km
Comparable races: 2
H2H: 8 Gegner:innen,
13 Duelle,
Korrektur 0.07 %,
Sicherheit 14 %
Ergebnis Lauf: 15:41 (3:08 / km)
Error: +0:43 / +0:09 / km
Overall prediction: 47:15
Data basis: 12 Races · Confidence 1.00
Swimming:
9:36
(1:17 / 100 m)
To the end of cycling (group time):
29:49
(43.3 km/h)
Run:
16:24
(3:17 / km)
Total:
47:15
Target first bike group at the bike finishGoal: finish the bike split with the first bike group.
Estimated requirement:
Swim time: 9:28
Pace: 1:16 / 100 m
About 7.6 s faster in the swim
Maximum predicted gap after the swim: +12.5 s
The complete bike-group simulation, including catches and group mergers, is recalculated through the end of the bike split.
|
| 8 / 24 |
Jhon Matias Tuesta Castro
ECU
|
+38 s
+63 s
|
G2 / G2
correct
|
16:28
16:10
|
47:19 | Show detailsPlacementPrediction: 8
80% range: 16–24
Top-10 probability: 0 %
Result: 24
Deviation: -16
SwimmingPrognoseabstand: +38 s
Time: 9:54
Pace: 1:19 / 100 m
Ergebnisabstand: +63 s
Fehler: -25.3 s
H2H: 16 Gegner:innen,
22 Duelle,
Korrektur 2.49 %,
Sicherheit 46 %
CyclingPrediction: Group 2 (38 people)
Gruppe 1: 29 %
Speed: 43.3 km/h
Initial Gruppe 3, später eingeholt/vereinigt
Gap ahead:
0.2 s
Gap behind:
0.0 s
Result: Group 2 (29 people)
Speed: 42.1 km/h
Tempo-Fehler: 1.20 km/h
Running and totalRun: 16:28 (3:18 / km)
Historical basis: 3:19 / km
Best comparable pace: 3:19 / km
Trend: +0:00 / km
Comparable races: 1
H2H: 11 Gegner:innen,
12 Duelle,
Korrektur -0.54 %,
Sicherheit 26 %
Ergebnis Lauf: 16:10 (3:14 / km)
Error: +0:18 / +0:04 / km
Overall prediction: 47:19
Data basis: 9 Races · Confidence 1.00
Swimming:
9:54
(1:19 / 100 m)
To the end of cycling (group time):
29:49
(43.3 km/h)
Run:
16:28
(3:18 / km)
Total:
47:19
Target first bike group at the bike finishGoal: finish the bike split with the first bike group.
Estimated requirement:
Swim time: 9:29
Pace: 1:16 / 100 m
About 25.2 s faster in the swim
Maximum predicted gap after the swim: +12.5 s
The complete bike-group simulation, including catches and group mergers, is recalculated through the end of the bike split.
|
| 9 / 25 |
Olivier Houle
CAN
|
+44 s
+51 s
|
G2 / G2
correct
|
16:28
16:18
|
47:19 | Show detailsPlacementPrediction: 9
80% range: 16–23
Top-10 probability: 0 %
Result: 25
Deviation: -16
SwimmingPrognoseabstand: +44 s
Time: 10:00
Pace: 1:20 / 100 m
Ergebnisabstand: +51 s
Fehler: -7.2 s
H2H: 5 Gegner:innen,
5 Duelle,
Korrektur 0.48 %,
Sicherheit 25 %
CyclingPrediction: Group 2 (38 people)
Gruppe 1: 33 %
Speed: 43.3 km/h
Initial Gruppe 4, später eingeholt/vereinigt
Gap ahead:
0.8 s
Gap behind:
2.2 s
Result: Group 2 (29 people)
Speed: 42.0 km/h
Tempo-Fehler: 1.36 km/h
Running and totalRun: 16:28 (3:18 / km)
Historical basis: 3:17 / km
Best comparable pace: 3:17 / km
Trend: +0:00 / km
Comparable races: 2
H2H: 5 Gegner:innen,
5 Duelle,
Korrektur 0.42 %,
Sicherheit 25 %
Ergebnis Lauf: 16:18 (3:16 / km)
Error: +0:10 / +0:02 / km
Overall prediction: 47:19
Data basis: 3 Races · Confidence 0.60
Swimming:
10:00
(1:20 / 100 m)
To the end of cycling (group time):
29:49
(43.3 km/h)
Run:
16:28
(3:18 / km)
Total:
47:19
Target first bike group at the bike finishGoal: finish the bike split with the first bike group.
Estimated requirement:
Swim time: 9:33
Pace: 1:16 / 100 m
About 27.3 s faster in the swim
Maximum predicted gap after the swim: +16.5 s
The complete bike-group simulation, including catches and group mergers, is recalculated through the end of the bike split.
|
| 10 / 12 |
Sebastian Zurob
CHI
|
+26 s
+24 s
|
G2 / G1
|
16:32
16:15
|
47:23 | Show detailsPlacementPrediction: 10
80% range: 14–24
Top-10 probability: 0 %
Result: 12
Deviation: -2
SwimmingPrognoseabstand: +26 s
Time: 9:42
Pace: 1:18 / 100 m
Ergebnisabstand: +24 s
Fehler: 1.5 s
H2H: 24 Gegner:innen,
43 Duelle,
Korrektur -0.10 %,
Sicherheit 100 %
CyclingPrediction: Group 2 (38 people)
Gruppe 1: 59 %
Speed: 43.3 km/h
Initial Gruppe 3, später eingeholt/vereinigt
Gap ahead:
3.4 s
Gap behind:
0.2 s
Result: Group 1 (18 people)
Speed: 43.8 km/h
Tempo-Fehler: -0.49 km/h
Running and totalRun: 16:32 (3:18 / km)
Historical basis: 3:19 / km
Best comparable pace: 2:52 / km
Trend: +0:00 / km
Comparable races: 6
H2H: 24 Gegner:innen,
43 Duelle,
Korrektur -0.39 %,
Sicherheit 98 %
Ergebnis Lauf: 16:15 (3:15 / km)
Error: +0:17 / +0:03 / km
Overall prediction: 47:23
Data basis: 12 Races · Confidence 1.00
Swimming:
9:42
(1:18 / 100 m)
To the end of cycling (group time):
29:49
(43.3 km/h)
Run:
16:32
(3:18 / km)
Total:
47:23
Target first bike group at the bike finishGoal: finish the bike split with the first bike group.
Estimated requirement:
Swim time: 9:29
Pace: 1:16 / 100 m
About 12.6 s faster in the swim
Maximum predicted gap after the swim: +12.9 s
The complete bike-group simulation, including catches and group mergers, is recalculated through the end of the bike split.
|
| 11 / 29 |
Enrique Pau
CHI
|
+38 s
+41 s
|
G2 / G2
correct
|
16:33
16:33
|
47:24 | Show detailsPlacementPrediction: 11
80% range: 16–25
Top-10 probability: 0 %
Result: 29
Deviation: -18
SwimmingPrognoseabstand: +38 s
Time: 9:54
Pace: 1:19 / 100 m
Ergebnisabstand: +41 s
Fehler: -2.7 s
H2H: 12 Gegner:innen,
20 Duelle,
Korrektur -0.01 %,
Sicherheit 48 %
CyclingPrediction: Group 2 (38 people)
Gruppe 1: 38 %
Speed: 43.3 km/h
Initial Gruppe 3, später eingeholt/vereinigt
Gap ahead:
0.3 s
Gap behind:
0.3 s
Result: Group 2 (29 people)
Speed: 41.6 km/h
Tempo-Fehler: 1.72 km/h
Running and totalRun: 16:33 (3:19 / km)
Historical basis: 3:17 / km
Best comparable pace: 3:17 / km
Trend: +0:00 / km
Comparable races: 1
H2H: 9 Gegner:innen,
13 Duelle,
Korrektur 0.99 %,
Sicherheit 40 %
Ergebnis Lauf: 16:33 (3:19 / km)
Error: +0:00 / −0:00 / km
Overall prediction: 47:24
Data basis: 5 Races · Confidence 1.00
Swimming:
9:54
(1:19 / 100 m)
To the end of cycling (group time):
29:49
(43.3 km/h)
Run:
16:33
(3:19 / km)
Total:
47:24
Target first bike group at the bike finishGoal: finish the bike split with the first bike group.
Estimated requirement:
Swim time: 9:28
Pace: 1:16 / 100 m
About 25.8 s faster in the swim
Maximum predicted gap after the swim: +12.5 s
The complete bike-group simulation, including catches and group mergers, is recalculated through the end of the bike split.
|
| 12 / 41 |
Diego Alessandro Sanchez Felix
PER
|
+32 s
+51 s
|
G2 / G2
correct
|
16:41
18:01
|
47:32 | Show detailsPlacementPrediction: 12
80% range: 18–32
Top-10 probability: 0 %
Result: 41
Deviation: -29
SwimmingPrognoseabstand: +32 s
Time: 9:48
Pace: 1:18 / 100 m
Ergebnisabstand: +51 s
Fehler: -19.0 s
H2H: 15 Gegner:innen,
20 Duelle,
Korrektur 0.02 %,
Sicherheit 30 %
CyclingPrediction: Group 2 (38 people)
Gruppe 1: 31 %
Speed: 43.3 km/h
Initial Gruppe 3, später eingeholt/vereinigt
Gap ahead:
2.1 s
Gap behind:
1.1 s
Result: Group 2 (29 people)
Speed: 42.1 km/h
Tempo-Fehler: 1.27 km/h
Running and totalRun: 16:41 (3:20 / km)
Historical basis: 3:20 / km
Best comparable pace: 3:20 / km
Trend: +0:00 / km
Comparable races: 1
H2H: 6 Gegner:innen,
8 Duelle,
Korrektur 0.25 %,
Sicherheit 23 %
Ergebnis Lauf: 18:01 (3:36 / km)
Error: −1:20 / −0:16 / km
Overall prediction: 47:32
Data basis: 6 Races · Confidence 1.00
Swimming:
9:48
(1:18 / 100 m)
To the end of cycling (group time):
29:49
(43.3 km/h)
Run:
16:41
(3:20 / km)
Total:
47:32
Target first bike group at the bike finishGoal: finish the bike split with the first bike group.
Estimated requirement:
Swim time: 9:29
Pace: 1:16 / 100 m
About 19.5 s faster in the swim
Maximum predicted gap after the swim: +12.5 s
The complete bike-group simulation, including catches and group mergers, is recalculated through the end of the bike split.
|
| 13 / 2 |
Nicolas Alejandro Calvopiña Castellano
ECU
|
+46 s
+25 s
|
G2 / G1
|
16:45
15:13
|
47:36 | Show detailsPlacementPrediction: 13
80% range: 12–37
Top-10 probability: 0 %
Result: 2
Deviation: 11
SwimmingPrognoseabstand: +46 s
Time: 10:02
Pace: 1:20 / 100 m
Ergebnisabstand: +25 s
Fehler: 21.0 s
H2H: 18 Gegner:innen,
31 Duelle,
Korrektur -0.60 %,
Sicherheit 68 %
CyclingPrediction: Group 2 (38 people)
Gruppe 1: 25 %
Speed: 43.3 km/h
Initial Gruppe 4, später eingeholt/vereinigt
Gap ahead:
2.2 s
Gap behind:
1.8 s
Result: Group 1 (18 people)
Speed: 43.9 km/h
Tempo-Fehler: -0.51 km/h
Running and totalRun: 16:45 (3:21 / km)
Historical basis: 3:22 / km
Best comparable pace: 2:53 / km
Trend: +0:00 / km
Comparable races: 6
H2H: 17 Gegner:innen,
23 Duelle,
Korrektur -0.56 %,
Sicherheit 49 %
Ergebnis Lauf: 15:13 (3:03 / km)
Error: +1:32 / +0:18 / km
Overall prediction: 47:36
Data basis: 11 Races · Confidence 1.00
Swimming:
10:02
(1:20 / 100 m)
To the end of cycling (group time):
29:49
(43.3 km/h)
Run:
16:45
(3:21 / km)
Total:
47:36
Target first bike group at the bike finishGoal: finish the bike split with the first bike group.
Estimated requirement:
Swim time: 9:29
Pace: 1:16 / 100 m
About 33.5 s faster in the swim
Maximum predicted gap after the swim: +12.5 s
The complete bike-group simulation, including catches and group mergers, is recalculated through the end of the bike split.
|
| 14 / 7 |
Luis Miguel Chávez Sanchez
MEX
|
+38 s
+2 s
|
G2 / G1
|
16:49
15:54
|
47:40 | Show detailsPlacementPrediction: 14
80% range: 16–30
Top-10 probability: 0 %
Result: 7
Deviation: 7
SwimmingPrognoseabstand: +38 s
Time: 9:54
Pace: 1:19 / 100 m
Ergebnisabstand: +2 s
Fehler: 36.0 s
H2H: 22 Gegner:innen,
46 Duelle,
Korrektur -0.23 %,
Sicherheit 100 %
CyclingPrediction: Group 2 (38 people)
Gruppe 1: 43 %
Speed: 43.3 km/h
Initial Gruppe 3, später eingeholt/vereinigt
Gap ahead:
0.3 s
Gap behind:
0.3 s
Result: Group 1 (18 people)
Speed: 43.1 km/h
Tempo-Fehler: 0.22 km/h
Running and totalRun: 16:49 (3:22 / km)
Historical basis: 3:22 / km
Best comparable pace: 2:58 / km
Trend: +0:00 / km
Comparable races: 7
H2H: 22 Gegner:innen,
46 Duelle,
Korrektur -0.33 %,
Sicherheit 94 %
Ergebnis Lauf: 15:54 (3:11 / km)
Error: +0:55 / +0:11 / km
Overall prediction: 47:40
Data basis: 12 Races · Confidence 1.00
Swimming:
9:54
(1:19 / 100 m)
To the end of cycling (group time):
29:49
(43.3 km/h)
Run:
16:49
(3:22 / km)
Total:
47:40
Target first bike group at the bike finishGoal: finish the bike split with the first bike group.
Estimated requirement:
Swim time: 9:29
Pace: 1:16 / 100 m
About 25.5 s faster in the swim
Maximum predicted gap after the swim: +12.5 s
The complete bike-group simulation, including catches and group mergers, is recalculated through the end of the bike split.
|
| 15 / 14 |
Raziel Geovanni Muñoz Tun
MEX
|
+39 s
+30 s
|
G2 / G1
|
17:05
16:40
|
47:56 | Show detailsPlacementPrediction: 15
80% range: 15–36
Top-10 probability: 0 %
Result: 14
Deviation: 1
SwimmingPrognoseabstand: +39 s
Time: 9:55
Pace: 1:19 / 100 m
Ergebnisabstand: +30 s
Fehler: 9.4 s
H2H: 19 Gegner:innen,
36 Duelle,
Korrektur -0.06 %,
Sicherheit 97 %
CyclingPrediction: Group 2 (38 people)
Gruppe 1: 41 %
Speed: 43.3 km/h
Initial Gruppe 3, später eingeholt/vereinigt
Gap ahead:
0.6 s
Gap behind:
1.5 s
Result: Group 1 (18 people)
Speed: 43.8 km/h
Tempo-Fehler: -0.44 km/h
Running and totalRun: 17:05 (3:25 / km)
Historical basis: 3:25 / km
Best comparable pace: 3:06 / km
Trend: +0:00 / km
Comparable races: 8
H2H: 19 Gegner:innen,
36 Duelle,
Korrektur 0.18 %,
Sicherheit 79 %
Ergebnis Lauf: 16:40 (3:20 / km)
Error: +0:25 / +0:05 / km
Overall prediction: 47:56
Data basis: 12 Races · Confidence 1.00
Swimming:
9:55
(1:19 / 100 m)
To the end of cycling (group time):
29:49
(43.3 km/h)
Run:
17:05
(3:25 / km)
Total:
47:56
Target first bike group at the bike finish
Cannot be calculated without a swim distance or historical swim data.
|
| 16 / 17 |
Raimundo Vicente San Martín Naranjo
CHI
|
+38 s
+25 s
|
G2 / G1
|
17:08
17:31
|
47:59 | Show detailsPlacementPrediction: 16
80% range: 21–28
Top-10 probability: 0 %
Result: 17
Deviation: -1
SwimmingPrognoseabstand: +38 s
Time: 9:54
Pace: 1:19 / 100 m
Ergebnisabstand: +25 s
Fehler: 12.5 s
H2H: 23 Gegner:innen,
31 Duelle,
Korrektur -0.03 %,
Sicherheit 93 %
CyclingPrediction: Group 2 (38 people)
Gruppe 1: 36 %
Speed: 43.3 km/h
Initial Gruppe 3, später eingeholt/vereinigt
Gap ahead:
0.5 s
Gap behind:
0.2 s
Result: Group 1 (18 people)
Speed: 43.8 km/h
Tempo-Fehler: -0.46 km/h
Running and totalRun: 17:08 (3:26 / km)
Historical basis: 3:21 / km
Best comparable pace: 3:21 / km
Trend: +0:00 / km
Comparable races: 2
H2H: 23 Gegner:innen,
31 Duelle,
Korrektur 2.48 %,
Sicherheit 78 %
Ergebnis Lauf: 17:31 (3:30 / km)
Error: −0:23 / −0:05 / km
Overall prediction: 47:59
Data basis: 6 Races · Confidence 1.00
Swimming:
9:54
(1:19 / 100 m)
To the end of cycling (group time):
29:49
(43.3 km/h)
Run:
17:08
(3:26 / km)
Total:
47:59
Target first bike group at the bike finishGoal: finish the bike split with the first bike group.
Estimated requirement:
Swim time: 9:28
Pace: 1:16 / 100 m
About 25.7 s faster in the swim
Maximum predicted gap after the swim: +11.8 s
The complete bike-group simulation, including catches and group mergers, is recalculated through the end of the bike split.
|
| 17 / 38 |
Antonio Alejandro Soria Mesa
ECU
|
+22 s
+58 s
|
G2 / G2
correct
|
17:29
17:38
|
48:20 | Show detailsPlacementPrediction: 17
80% range: 22–28
Top-10 probability: 0 %
Result: 38
Deviation: -21
SwimmingPrognoseabstand: +22 s
Time: 9:38
Pace: 1:17 / 100 m
Ergebnisabstand: +58 s
Fehler: -35.9 s
H2H: 7 Gegner:innen,
12 Duelle,
Korrektur 1.64 %,
Sicherheit 19 %
CyclingPrediction: Group 2 (38 people)
Gruppe 1: 53 %
Speed: 43.3 km/h
Initial Gruppe 3, später eingeholt/vereinigt
Gap ahead:
2.0 s
Gap behind:
3.4 s
Result: Group 2 (29 people)
Speed: 41.9 km/h
Tempo-Fehler: 1.43 km/h
Running and totalRun: 17:29 (3:30 / km)
Historical basis: 3:30 / km
Best comparable pace: 3:30 / km
Trend: +0:00 / km
Comparable races: 1
H2H: 4 Gegner:innen,
4 Duelle,
Korrektur -0.04 %,
Sicherheit 11 %
Ergebnis Lauf: 17:38 (3:32 / km)
Error: −0:09 / −0:02 / km
Overall prediction: 48:20
Data basis: 4 Races · Confidence 0.80
Swimming:
9:38
(1:17 / 100 m)
To the end of cycling (group time):
29:49
(43.3 km/h)
Run:
17:29
(3:30 / km)
Total:
48:20
Target first bike group at the bike finishGoal: finish the bike split with the first bike group.
Estimated requirement:
Swim time: 9:36
Pace: 1:17 / 100 m
About 1.7 s faster in the swim
Maximum predicted gap after the swim: +20.4 s
The complete bike-group simulation, including catches and group mergers, is recalculated through the end of the bike split.
|
| 18 / 20 |
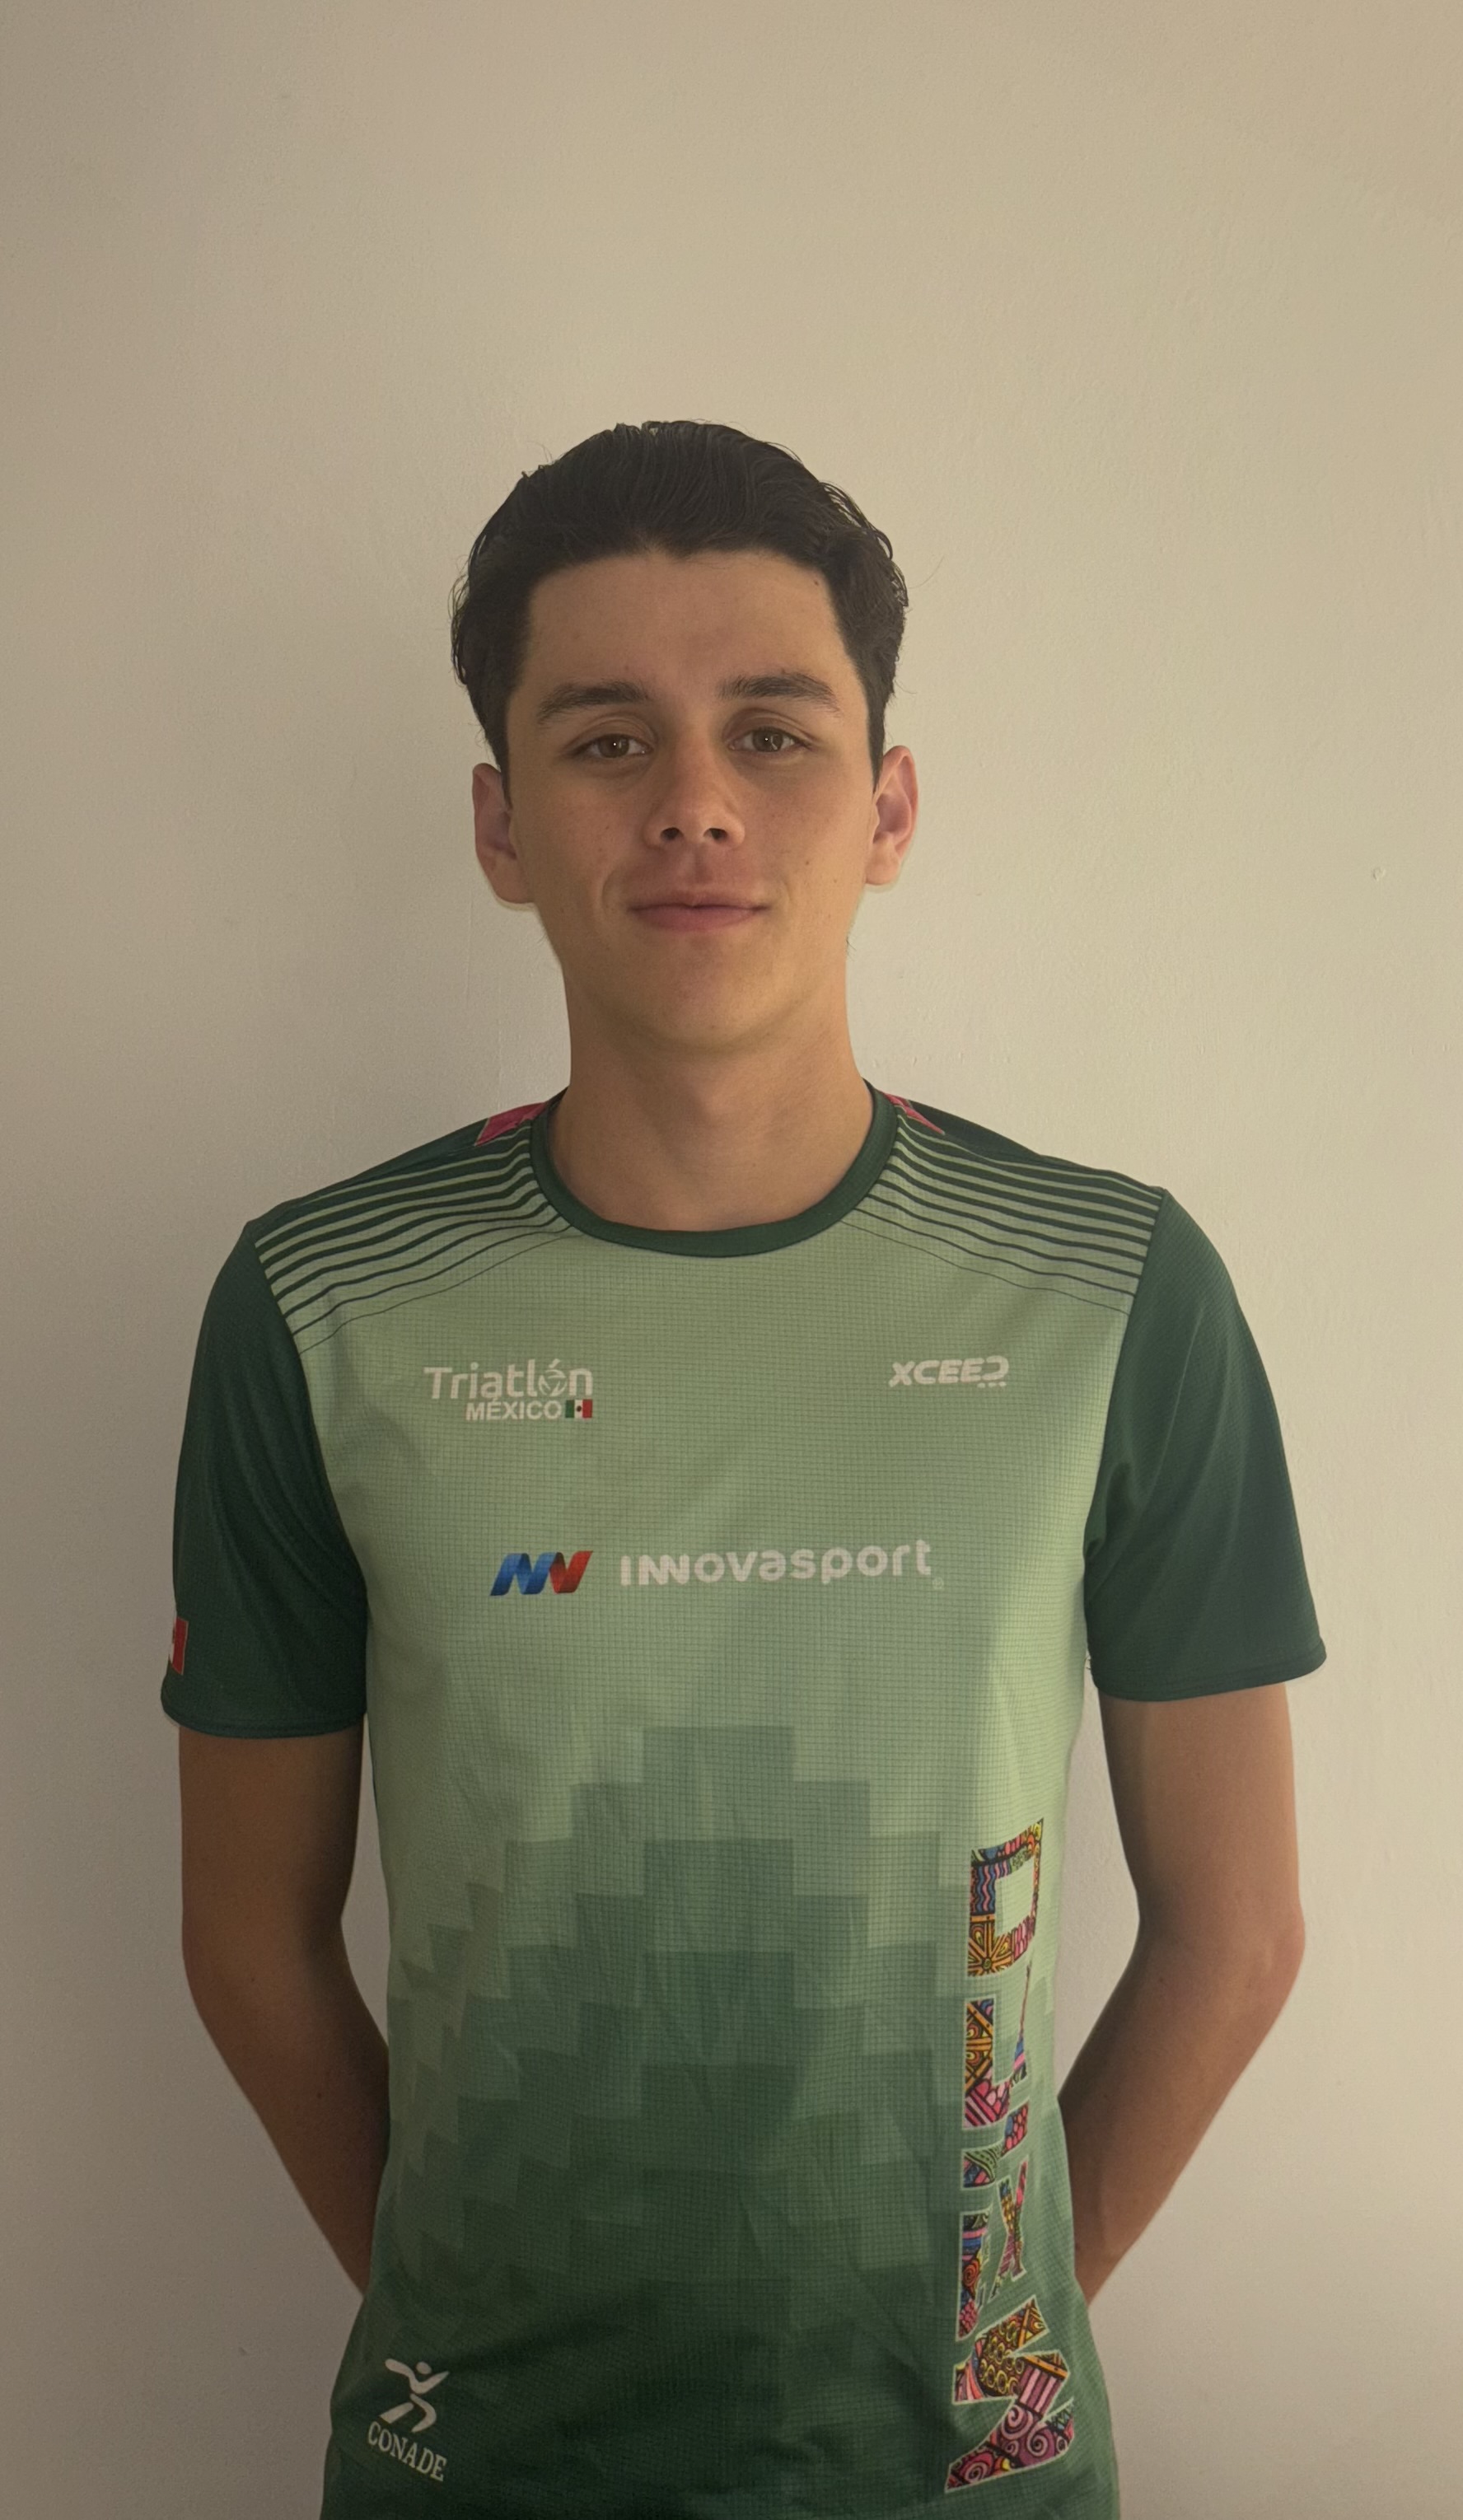 Alejandro Pérez Monterd
MEX
|
+37 s
+59 s
|
G2 / G2
correct
|
17:51
15:55
|
48:42 | Show detailsPlacementPrediction: 18
80% range: 26–30
Top-10 probability: 0 %
Result: 20
Deviation: -2
SwimmingPrognoseabstand: +37 s
Time: 9:53
Pace: 1:19 / 100 m
Ergebnisabstand: +59 s
Fehler: -22.0 s
H2H: 10 Gegner:innen,
16 Duelle,
Korrektur 0.24 %,
Sicherheit 36 %
CyclingPrediction: Group 2 (38 people)
Gruppe 1: 38 %
Speed: 43.3 km/h
Initial Gruppe 3, später eingeholt/vereinigt
Gap ahead:
0.1 s
Gap behind:
0.5 s
Result: Group 2 (29 people)
Speed: 42.2 km/h
Tempo-Fehler: 1.18 km/h
Running and totalRun: 17:51 (3:34 / km)
Historical basis: 3:38 / km
Best comparable pace: 3:30 / km
Trend: −0:03 / km
Comparable races: 4
H2H: 10 Gegner:innen,
16 Duelle,
Korrektur -0.08 %,
Sicherheit 34 %
Ergebnis Lauf: 15:55 (3:11 / km)
Error: +1:56 / +0:23 / km
Overall prediction: 48:42
Data basis: 6 Races · Confidence 1.00
Swimming:
9:53
(1:19 / 100 m)
To the end of cycling (group time):
29:49
(43.3 km/h)
Run:
17:51
(3:34 / km)
Total:
48:42
Target first bike group at the bike finishGoal: finish the bike split with the first bike group.
Estimated requirement:
Swim time: 9:29
Pace: 1:16 / 100 m
About 24.5 s faster in the swim
Maximum predicted gap after the swim: +12.5 s
The complete bike-group simulation, including catches and group mergers, is recalculated through the end of the bike split.
|
| 19 / 4 |
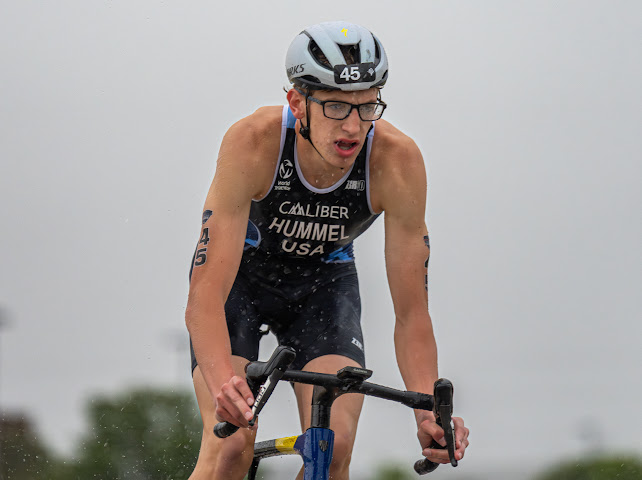 Graham Hummel
USA
|
+41 s
+0 s
|
G2 / G1
|
17:51
15:21
|
48:42 | Show detailsPlacementPrediction: 19
80% range: 19–39
Top-10 probability: 0 %
Result: 4
Deviation: 15
SwimmingPrognoseabstand: +41 s
Time: 9:57
Pace: 1:20 / 100 m
Ergebnisabstand: +0 s
Fehler: 40.9 s
H2H: 21 Gegner:innen,
25 Duelle,
Korrektur -0.42 %,
Sicherheit 89 %
CyclingPrediction: Group 2 (38 people)
Gruppe 1: 41 %
Speed: 43.3 km/h
Initial Gruppe 4, später eingeholt/vereinigt
Gap ahead:
1.5 s
Gap behind:
0.6 s
Result: Group 1 (18 people)
Speed: 43.2 km/h
Tempo-Fehler: 0.12 km/h
Running and totalRun: 17:51 (3:34 / km)
Historical basis: 3:35 / km
Best comparable pace: 3:04 / km
Trend: +0:00 / km
Comparable races: 3
H2H: 21 Gegner:innen,
25 Duelle,
Korrektur -0.44 %,
Sicherheit 84 %
Ergebnis Lauf: 15:21 (3:04 / km)
Error: +2:30 / +0:30 / km
Overall prediction: 48:42
Data basis: 8 Races · Confidence 1.00
Swimming:
9:57
(1:20 / 100 m)
To the end of cycling (group time):
29:49
(43.3 km/h)
Run:
17:51
(3:34 / km)
Total:
48:42
Target first bike group at the bike finishGoal: finish the bike split with the first bike group.
Estimated requirement:
Swim time: 9:29
Pace: 1:16 / 100 m
About 28 s faster in the swim
Maximum predicted gap after the swim: +12.9 s
The complete bike-group simulation, including catches and group mergers, is recalculated through the end of the bike split.
|
| 20 / 47 |
Christiaan Jansen
ARU
|
+62 s
+75 s
|
G2 / G3
|
18:07
17:21
|
48:58 | Show detailsPlacementPrediction: 20
80% range: 26–47
Top-10 probability: 0 %
Result: 47
Deviation: -27
SwimmingPrognoseabstand: +62 s
Time: 10:18
Pace: 1:22 / 100 m
Ergebnisabstand: +75 s
Fehler: -13.1 s
H2H: 25 Gegner:innen,
39 Duelle,
Korrektur -0.31 %,
Sicherheit 90 %
CyclingPrediction: Group 2 (38 people)
Gruppe 1: 10 %
Speed: 43.3 km/h
Initial Gruppe 4, später eingeholt/vereinigt
Gap ahead:
2.5 s
Gap behind:
4.6 s
Result: Group 3 (5 people)
Speed: 39.3 km/h
Tempo-Fehler: 4.07 km/h
Running and totalRun: 18:07 (3:37 / km)
Historical basis: 3:39 / km
Best comparable pace: 3:29 / km
Trend: +0:00 / km
Comparable races: 3
H2H: 24 Gegner:innen,
37 Duelle,
Korrektur -0.69 %,
Sicherheit 76 %
Ergebnis Lauf: 17:21 (3:28 / km)
Error: +0:46 / +0:09 / km
Overall prediction: 48:58
Data basis: 12 Races · Confidence 1.00
Swimming:
10:18
(1:22 / 100 m)
To the end of cycling (group time):
29:49
(43.3 km/h)
Run:
18:07
(3:37 / km)
Total:
48:58
Target first bike group at the bike finishGoal: finish the bike split with the first bike group.
Estimated requirement:
Swim time: 9:31
Pace: 1:16 / 100 m
About 47 s faster in the swim
Maximum predicted gap after the swim: +14.9 s
The complete bike-group simulation, including catches and group mergers, is recalculated through the end of the bike split.
|
| 21 / 43 |
Gaspar Reyes
CHI
|
+53 s
+42 s
|
G2 / G2
correct
|
18:13
18:37
|
49:04 | Show detailsPlacementPrediction: 21
80% range: 28–36
Top-10 probability: 0 %
Result: 43
Deviation: -22
SwimmingPrognoseabstand: +53 s
Time: 10:09
Pace: 1:21 / 100 m
Ergebnisabstand: +42 s
Fehler: 10.5 s
H2H: 6 Gegner:innen,
6 Duelle,
Korrektur -0.01 %,
Sicherheit 25 %
CyclingPrediction: Group 2 (38 people)
Gruppe 1: 18 %
Speed: 43.3 km/h
Initial Gruppe 4, später eingeholt/vereinigt
Gap ahead:
1.6 s
Gap behind:
0.8 s
Result: Group 2 (29 people)
Speed: 41.9 km/h
Tempo-Fehler: 1.50 km/h
Running and totalRun: 18:13 (3:39 / km)
Historical basis: 3:38 / km
Best comparable pace: 3:38 / km
Trend: +0:00 / km
Comparable races: 1
H2H: 6 Gegner:innen,
6 Duelle,
Korrektur 0.23 %,
Sicherheit 25 %
Ergebnis Lauf: 18:37 (3:43 / km)
Error: −0:24 / −0:05 / km
Overall prediction: 49:04
Data basis: 2 Races · Confidence 0.40
Swimming:
10:09
(1:21 / 100 m)
To the end of cycling (group time):
29:49
(43.3 km/h)
Run:
18:13
(3:39 / km)
Total:
49:04
Target first bike group at the bike finishGoal: finish the bike split with the first bike group.
Estimated requirement:
Swim time: 9:29
Pace: 1:16 / 100 m
About 39.6 s faster in the swim
Maximum predicted gap after the swim: +12.9 s
The complete bike-group simulation, including catches and group mergers, is recalculated through the end of the bike split.
|
| 22 / 23 |
 Wills Gillis
USA
|
+55 s
+49 s
|
G2 / G2
correct
|
18:14
16:08
|
49:05 | Show detailsPlacementPrediction: 22
80% range: 28–44
Top-10 probability: 0 %
Result: 23
Deviation: -1
SwimmingPrognoseabstand: +55 s
Time: 10:11
Pace: 1:21 / 100 m
Ergebnisabstand: +49 s
Fehler: 6.1 s
H2H: 13 Gegner:innen,
18 Duelle,
Korrektur 0.42 %,
Sicherheit 49 %
CyclingPrediction: Group 2 (38 people)
Gruppe 1: 24 %
Speed: 43.3 km/h
Initial Gruppe 4, später eingeholt/vereinigt
Gap ahead:
1.5 s
Gap behind:
1.6 s
Result: Group 2 (29 people)
Speed: 42.0 km/h
Tempo-Fehler: 1.36 km/h
Running and totalRun: 18:14 (3:39 / km)
Historical basis: 3:39 / km
Best comparable pace: 3:39 / km
Trend: +0:00 / km
Comparable races: 3
H2H: 13 Gegner:innen,
18 Duelle,
Korrektur 0.00 %,
Sicherheit 44 %
Ergebnis Lauf: 16:08 (3:14 / km)
Error: +2:06 / +0:25 / km
Overall prediction: 49:05
Data basis: 5 Races · Confidence 1.00
Swimming:
10:11
(1:21 / 100 m)
To the end of cycling (group time):
29:49
(43.3 km/h)
Run:
18:14
(3:39 / km)
Total:
49:05
Target first bike group at the bike finishGoal: finish the bike split with the first bike group.
Estimated requirement:
Swim time: 9:28
Pace: 1:16 / 100 m
About 42.6 s faster in the swim
Maximum predicted gap after the swim: +12.5 s
The complete bike-group simulation, including catches and group mergers, is recalculated through the end of the bike split.
|
| 23 / 11 |
Athur Pereira Morer
BRA
|
+30 s
+31 s
|
G2 / G1
|
18:19
16:07
|
49:10 | Show detailsPlacementPrediction: 23
80% range: 28–36
Top-10 probability: 0 %
Result: 11
Deviation: 12
SwimmingPrognoseabstand: +30 s
Time: 9:46
Pace: 1:18 / 100 m
Ergebnisabstand: +31 s
Fehler: -1.1 s
H2H: 18 Gegner:innen,
23 Duelle,
Korrektur 0.80 %,
Sicherheit 67 %
CyclingPrediction: Group 2 (38 people)
Gruppe 1: 36 %
Speed: 43.3 km/h
Initial Gruppe 3, später eingeholt/vereinigt
Gap ahead:
1.1 s
Gap behind:
2.1 s
Result: Group 1 (18 people)
Speed: 44.0 km/h
Tempo-Fehler: -0.61 km/h
Running and totalRun: 18:19 (3:40 / km)
Historical basis: 3:42 / km
Best comparable pace: 3:42 / km
Trend: +0:00 / km
Comparable races: 2
H2H: 17 Gegner:innen,
22 Duelle,
Korrektur -1.16 %,
Sicherheit 63 %
Ergebnis Lauf: 16:07 (3:13 / km)
Error: +2:12 / +0:26 / km
Overall prediction: 49:10
Data basis: 7 Races · Confidence 1.00
Swimming:
9:46
(1:18 / 100 m)
To the end of cycling (group time):
29:49
(43.3 km/h)
Run:
18:19
(3:40 / km)
Total:
49:10
Target first bike group at the bike finishGoal: finish the bike split with the first bike group.
Estimated requirement:
Swim time: 9:29
Pace: 1:16 / 100 m
About 17.4 s faster in the swim
Maximum predicted gap after the swim: +12.5 s
The complete bike-group simulation, including catches and group mergers, is recalculated through the end of the bike split.
|
| 24 / 36 |
Oliver Hayward
BER
|
+38 s
+22 s
|
G2 / G2
correct
|
18:24
17:48
|
49:15 | Show detailsPlacementPrediction: 24
80% range: 29–35
Top-10 probability: 0 %
Result: 36
Deviation: -12
SwimmingPrognoseabstand: +38 s
Time: 9:54
Pace: 1:19 / 100 m
Ergebnisabstand: +22 s
Fehler: 15.7 s
H2H: 7 Gegner:innen,
8 Duelle,
Korrektur 1.90 %,
Sicherheit 11 %
CyclingPrediction: Group 2 (38 people)
Gruppe 1: 33 %
Speed: 43.3 km/h
Initial Gruppe 3, später eingeholt/vereinigt
Gap ahead:
0.0 s
Gap behind:
0.3 s
Result: Group 2 (29 people)
Speed: 41.6 km/h
Tempo-Fehler: 1.76 km/h
Running and totalRun: 18:24 (3:41 / km)
Historical basis: 3:39 / km
Best comparable pace: 3:36 / km
Trend: +0:00 / km
Comparable races: 3
H2H: 7 Gegner:innen,
8 Duelle,
Korrektur 1.00 %,
Sicherheit 11 %
Ergebnis Lauf: 17:48 (3:34 / km)
Error: +0:36 / +0:07 / km
Overall prediction: 49:15
Data basis: 3 Races · Confidence 0.60
Swimming:
9:54
(1:19 / 100 m)
To the end of cycling (group time):
29:49
(43.3 km/h)
Run:
18:24
(3:41 / km)
Total:
49:15
Target first bike group at the bike finishGoal: finish the bike split with the first bike group.
Estimated requirement:
Swim time: 9:29
Pace: 1:16 / 100 m
About 25.2 s faster in the swim
Maximum predicted gap after the swim: +12.5 s
The complete bike-group simulation, including catches and group mergers, is recalculated through the end of the bike split.
|
| 25 / 8 |
Luke McIntyre
BAR
|
+42 s
+26 s
|
G2 / G1
|
18:30
15:52
|
49:21 | Show detailsPlacementPrediction: 25
80% range: 30–37
Top-10 probability: 0 %
Result: 8
Deviation: 17
SwimmingPrognoseabstand: +42 s
Time: 9:58
Pace: 1:20 / 100 m
Ergebnisabstand: +26 s
Fehler: 16.0 s
H2H: 7 Gegner:innen,
10 Duelle,
Korrektur -0.18 %,
Sicherheit 25 %
CyclingPrediction: Group 2 (38 people)
Gruppe 1: 28 %
Speed: 43.3 km/h
Initial Gruppe 4, später eingeholt/vereinigt
Gap ahead:
0.5 s
Gap behind:
1.0 s
Result: Group 1 (18 people)
Speed: 43.8 km/h
Tempo-Fehler: -0.46 km/h
Running and totalRun: 18:30 (3:42 / km)
Historical basis: 3:42 / km
Best comparable pace: 3:42 / km
Trend: +0:00 / km
Comparable races: 1
H2H: 7 Gegner:innen,
10 Duelle,
Korrektur 0.06 %,
Sicherheit 23 %
Ergebnis Lauf: 15:52 (3:10 / km)
Error: +2:38 / +0:32 / km
Overall prediction: 49:21
Data basis: 7 Races · Confidence 1.00
Swimming:
9:58
(1:20 / 100 m)
To the end of cycling (group time):
29:49
(43.3 km/h)
Run:
18:30
(3:42 / km)
Total:
49:21
Target first bike group at the bike finishGoal: finish the bike split with the first bike group.
Estimated requirement:
Swim time: 9:29
Pace: 1:16 / 100 m
About 29.5 s faster in the swim
Maximum predicted gap after the swim: +12.5 s
The complete bike-group simulation, including catches and group mergers, is recalculated through the end of the bike split.
|
| 26 / 50 |
Dylan Giel
ARU
|
+59 s
+77 s
|
G2 / G3
|
18:52
18:36
|
49:43 | Show detailsPlacementPrediction: 26
80% range: 32–48
Top-10 probability: 0 %
Result: 50
Deviation: -24
SwimmingPrognoseabstand: +59 s
Time: 10:15
Pace: 1:22 / 100 m
Ergebnisabstand: +77 s
Fehler: -17.6 s
H2H: 14 Gegner:innen,
17 Duelle,
Korrektur 0.24 %,
Sicherheit 33 %
CyclingPrediction: Group 2 (38 people)
Gruppe 1: 10 %
Speed: 43.3 km/h
Initial Gruppe 4, später eingeholt/vereinigt
Gap ahead:
2.7 s
Gap behind:
2.5 s
Result: Group 3 (5 people)
Speed: 39.4 km/h
Tempo-Fehler: 3.97 km/h
Running and totalRun: 18:52 (3:46 / km)
Historical basis: 3:48 / km
Best comparable pace: 3:45 / km
Trend: +0:00 / km
Comparable races: 3
H2H: 5 Gegner:innen,
8 Duelle,
Korrektur -0.87 %,
Sicherheit 16 %
Ergebnis Lauf: 18:36 (3:43 / km)
Error: +0:16 / +0:03 / km
Overall prediction: 49:43
Data basis: 7 Races · Confidence 1.00
Swimming:
10:15
(1:22 / 100 m)
To the end of cycling (group time):
29:49
(43.3 km/h)
Run:
18:52
(3:46 / km)
Total:
49:43
Target first bike group at the bike finishGoal: finish the bike split with the first bike group.
Estimated requirement:
Swim time: 9:28
Pace: 1:16 / 100 m
About 46.9 s faster in the swim
Maximum predicted gap after the swim: +12.5 s
The complete bike-group simulation, including catches and group mergers, is recalculated through the end of the bike split.
|
| 27 / 30 |
Walter Steffen
USA
|
+48 s
+69 s
|
G2 / G2
correct
|
18:56
16:33
|
49:47 | Show detailsPlacementPrediction: 27
80% range: 34–40
Top-10 probability: 0 %
Result: 30
Deviation: -3
SwimmingPrognoseabstand: +48 s
Time: 10:04
Pace: 1:21 / 100 m
Ergebnisabstand: +69 s
Fehler: -21.2 s
H2H: 5 Gegner:innen,
5 Duelle,
Korrektur 0.23 %,
Sicherheit 30 %
CyclingPrediction: Group 2 (38 people)
Gruppe 1: 26 %
Speed: 43.3 km/h
Initial Gruppe 4, später eingeholt/vereinigt
Gap ahead:
1.8 s
Gap behind:
0.1 s
Result: Group 2 (29 people)
Speed: 42.2 km/h
Tempo-Fehler: 1.15 km/h
Running and totalRun: 18:56 (3:47 / km)
Historical basis: 3:47 / km
Best comparable pace: 3:47 / km
Trend: +0:00 / km
Comparable races: 1
H2H: 5 Gegner:innen,
5 Duelle,
Korrektur 0.00 %,
Sicherheit 30 %
Ergebnis Lauf: 16:33 (3:19 / km)
Error: +2:23 / +0:29 / km
Overall prediction: 49:47
Data basis: 1 Races · Confidence 0.20
Swimming:
10:04
(1:21 / 100 m)
To the end of cycling (group time):
29:49
(43.3 km/h)
Run:
18:56
(3:47 / km)
Total:
49:47
Target first bike group at the bike finishGoal: finish the bike split with the first bike group.
Estimated requirement:
Swim time: 9:33
Pace: 1:16 / 100 m
About 31.3 s faster in the swim
Maximum predicted gap after the swim: +16.5 s
The complete bike-group simulation, including catches and group mergers, is recalculated through the end of the bike split.
|
| 28 / 27 |
Sergio Campos Hernandez
CRC
|
+57 s
+53 s
|
G2 / G2
correct
|
19:04
16:09
|
49:55 | Show detailsPlacementPrediction: 28
80% range: 35–48
Top-10 probability: 0 %
Result: 27
Deviation: 1
SwimmingPrognoseabstand: +57 s
Time: 10:13
Pace: 1:22 / 100 m
Ergebnisabstand: +53 s
Fehler: 3.7 s
H2H: 18 Gegner:innen,
24 Duelle,
Korrektur -0.12 %,
Sicherheit 79 %
CyclingPrediction: Group 2 (38 people)
Gruppe 1: 20 %
Speed: 43.3 km/h
Initial Gruppe 4, später eingeholt/vereinigt
Gap ahead:
1.6 s
Gap behind:
2.7 s
Result: Group 2 (29 people)
Speed: 42.0 km/h
Tempo-Fehler: 1.34 km/h
Running and totalRun: 19:04 (3:49 / km)
Historical basis: 3:53 / km
Best comparable pace: 3:53 / km
Trend: +0:00 / km
Comparable races: 1
H2H: 16 Gegner:innen,
20 Duelle,
Korrektur -1.86 %,
Sicherheit 63 %
Ergebnis Lauf: 16:09 (3:14 / km)
Error: +2:55 / +0:35 / km
Overall prediction: 49:55
Data basis: 6 Races · Confidence 1.00
Swimming:
10:13
(1:22 / 100 m)
To the end of cycling (group time):
29:49
(43.3 km/h)
Run:
19:04
(3:49 / km)
Total:
49:55
Target first bike group at the bike finishGoal: finish the bike split with the first bike group.
Estimated requirement:
Swim time: 9:29
Pace: 1:16 / 100 m
About 44.2 s faster in the swim
Maximum predicted gap after the swim: +12.5 s
The complete bike-group simulation, including catches and group mergers, is recalculated through the end of the bike split.
|
| 29 / 19 |
Caden Hubers
CAN
|
+50 s
+43 s
|
G2 / G1
|
19:07
17:43
|
49:58 | Show detailsPlacementPrediction: 29
80% range: 26–45
Top-10 probability: 0 %
Result: 19
Deviation: 10
SwimmingPrognoseabstand: +50 s
Time: 10:06
Pace: 1:21 / 100 m
Ergebnisabstand: +43 s
Fehler: 7.3 s
H2H: 16 Gegner:innen,
19 Duelle,
Korrektur -0.70 %,
Sicherheit 58 %
CyclingPrediction: Group 2 (38 people)
Gruppe 1: 23 %
Speed: 43.3 km/h
Initial Gruppe 4, später eingeholt/vereinigt
Gap ahead:
2.4 s
Gap behind:
0.6 s
Result: Group 1 (18 people)
Speed: 44.4 km/h
Tempo-Fehler: -1.01 km/h
Running and totalRun: 19:07 (3:49 / km)
Historical basis: 3:54 / km
Best comparable pace: 3:40 / km
Trend: −0:04 / km
Comparable races: 4
H2H: 16 Gegner:innen,
20 Duelle,
Korrektur -0.25 %,
Sicherheit 58 %
Ergebnis Lauf: 17:43 (3:33 / km)
Error: +1:24 / +0:17 / km
Overall prediction: 49:58
Data basis: 4 Races · Confidence 0.80
Swimming:
10:06
(1:21 / 100 m)
To the end of cycling (group time):
29:49
(43.3 km/h)
Run:
19:07
(3:49 / km)
Total:
49:58
Target first bike group at the bike finishGoal: finish the bike split with the first bike group.
Estimated requirement:
Swim time: 9:28
Pace: 1:16 / 100 m
About 37.8 s faster in the swim
Maximum predicted gap after the swim: +12.5 s
The complete bike-group simulation, including catches and group mergers, is recalculated through the end of the bike split.
|
| 30 / 48 |
Santino Calderón Lucoratolo
ARG
|
+104 s
+81 s
|
G3 / G3
correct
|
15:59
18:09
|
50:11 | Show detailsPlacementPrediction: 30
80% range: 33–46
Top-10 probability: 0 %
Result: 48
Deviation: -18
SwimmingPrognoseabstand: +104 s
Time: 11:00
Pace: 1:28 / 100 m
Ergebnisabstand: +81 s
Fehler: 23.2 s
H2H: 17 Gegner:innen,
25 Duelle,
Korrektur -0.09 %,
Sicherheit 82 %
CyclingPrediction: Group 3 (5 people)
Gruppe 1: 0 %
Speed: 40.0 km/h
Initial Gruppe 7, später eingeholt/vereinigt
Gap ahead:
20.4 s
Gap behind:
20.1 s
Result: Group 3 (5 people)
Speed: 39.5 km/h
Tempo-Fehler: 0.44 km/h
Running and totalRun: 15:59 (3:12 / km)
Historical basis: 3:09 / km
Best comparable pace: 3:09 / km
Trend: +0:00 / km
Comparable races: 1
H2H: 12 Gegner:innen,
15 Duelle,
Korrektur 1.67 %,
Sicherheit 59 %
Ergebnis Lauf: 18:09 (3:38 / km)
Error: −2:10 / −0:26 / km
Overall prediction: 50:11
Data basis: 9 Races · Confidence 1.00
Swimming:
11:00
(1:28 / 100 m)
To the end of cycling (group time):
32:28
(40.0 km/h)
Run:
15:59
(3:12 / km)
Total:
50:11
Target first bike group at the bike finishGoal: finish the bike split with the first bike group.
Estimated requirement:
Swim time: 9:28
Pace: 1:16 / 100 m
About 91.7 s faster in the swim
Maximum predicted gap after the swim: +12.5 s
The complete bike-group simulation, including catches and group mergers, is recalculated through the end of the bike split.
|
| 31 / 35 |
Maximiliano Bobadilla
CHI
|
+67 s
+67 s
|
G3 / G2
|
16:06
17:40
|
50:18 | Show detailsPlacementPrediction: 31
80% range: 19–39
Top-10 probability: 0 %
Result: 35
Deviation: -4
SwimmingPrognoseabstand: +67 s
Time: 10:23
Pace: 1:23 / 100 m
Ergebnisabstand: +67 s
Fehler: -0.5 s
H2H: 12 Gegner:innen,
19 Duelle,
Korrektur -0.04 %,
Sicherheit 34 %
CyclingPrediction: Group 3 (5 people)
Gruppe 1: 3 %
Speed: 40.0 km/h
Initial Gruppe 5, später eingeholt/vereinigt
Gap ahead:
4.6 s
Gap behind:
2.5 s
Result: Group 2 (29 people)
Speed: 42.2 km/h
Tempo-Fehler: -2.28 km/h
Running and totalRun: 16:06 (3:13 / km)
Historical basis: 3:12 / km
Best comparable pace: 3:12 / km
Trend: +0:00 / km
Comparable races: 1
H2H: 9 Gegner:innen,
12 Duelle,
Korrektur 0.62 %,
Sicherheit 24 %
Ergebnis Lauf: 17:40 (3:32 / km)
Error: −1:34 / −0:19 / km
Overall prediction: 50:18
Data basis: 4 Races · Confidence 0.80
Swimming:
10:23
(1:23 / 100 m)
To the end of cycling (group time):
32:28
(40.0 km/h)
Run:
16:06
(3:13 / km)
Total:
50:18
Target first bike group at the bike finishGoal: finish the bike split with the first bike group.
Estimated requirement:
Swim time: 9:29
Pace: 1:16 / 100 m
About 54 s faster in the swim
Maximum predicted gap after the swim: +12.5 s
The complete bike-group simulation, including catches and group mergers, is recalculated through the end of the bike split.
|
| 32 / 16 |
Jesus David Salazar Severino
COL
|
+39 s
+21 s
|
G2 / G1
|
19:30
17:15
|
50:21 | Show detailsPlacementPrediction: 32
80% range: 36–42
Top-10 probability: 0 %
Result: 16
Deviation: 16
SwimmingPrognoseabstand: +39 s
Time: 9:55
Pace: 1:19 / 100 m
Ergebnisabstand: +21 s
Fehler: 17.6 s
H2H: 4 Gegner:innen,
4 Duelle,
Korrektur -1.22 %,
Sicherheit 4 %
CyclingPrediction: Group 2 (38 people)
Gruppe 1: 31 %
Speed: 43.3 km/h
Initial Gruppe 3, später eingeholt/vereinigt
Gap ahead:
0.3 s
Gap behind:
0.2 s
Result: Group 1 (18 people)
Speed: 43.7 km/h
Tempo-Fehler: -0.39 km/h
Running and totalRun: 19:30 (3:54 / km)
Historical basis: 3:59 / km
Best comparable pace: 3:59 / km
Trend: +0:00 / km
Comparable races: 1
H2H: 4 Gegner:innen,
4 Duelle,
Korrektur -2.04 %,
Sicherheit 4 %
Ergebnis Lauf: 17:15 (3:27 / km)
Error: +2:15 / +0:27 / km
Overall prediction: 50:21
Data basis: 2 Races · Confidence 0.40
Swimming:
9:55
(1:19 / 100 m)
To the end of cycling (group time):
29:49
(43.3 km/h)
Run:
19:30
(3:54 / km)
Total:
50:21
Target first bike group at the bike finishGoal: finish the bike split with the first bike group.
Estimated requirement:
Swim time: 9:29
Pace: 1:16 / 100 m
About 26.1 s faster in the swim
Maximum predicted gap after the swim: +12.5 s
The complete bike-group simulation, including catches and group mergers, is recalculated through the end of the bike split.
|
| 33 / 15 |
Nathanael Hamilton
USA
|
+33 s
+26 s
|
G2 / G1
|
19:50
16:55
|
50:41 | Show detailsPlacementPrediction: 33
80% range: 38–43
Top-10 probability: 0 %
Result: 15
Deviation: 18
SwimmingPrognoseabstand: +33 s
Time: 9:49
Pace: 1:19 / 100 m
Ergebnisabstand: +26 s
Fehler: 7.1 s
H2H: 7 Gegner:innen,
10 Duelle,
Korrektur 0.40 %,
Sicherheit 45 %
CyclingPrediction: Group 2 (38 people)
Gruppe 1: 41 %
Speed: 43.3 km/h
Initial Gruppe 3, später eingeholt/vereinigt
Gap ahead:
1.1 s
Gap behind:
0.8 s
Result: Group 1 (18 people)
Speed: 43.9 km/h
Tempo-Fehler: -0.56 km/h
Running and totalRun: 19:50 (3:58 / km)
Historical basis: 4:00 / km
Best comparable pace: 4:00 / km
Trend: +0:00 / km
Comparable races: 1
H2H: 7 Gegner:innen,
10 Duelle,
Korrektur -0.68 %,
Sicherheit 34 %
Ergebnis Lauf: 16:55 (3:23 / km)
Error: +2:55 / +0:35 / km
Overall prediction: 50:41
Data basis: 2 Races · Confidence 0.40
Swimming:
9:49
(1:19 / 100 m)
To the end of cycling (group time):
29:49
(43.3 km/h)
Run:
19:50
(3:58 / km)
Total:
50:41
Target first bike group at the bike finishGoal: finish the bike split with the first bike group.
Estimated requirement:
Swim time: 9:29
Pace: 1:16 / 100 m
About 20.2 s faster in the swim
Maximum predicted gap after the swim: +12.9 s
The complete bike-group simulation, including catches and group mergers, is recalculated through the end of the bike split.
|
| 34 / 6 |
Brice Allen
USA
|
+39 s
+25 s
|
G2 / G1
|
19:56
15:44
|
50:47 | Show detailsPlacementPrediction: 34
80% range: 39–44
Top-10 probability: 0 %
Result: 6
Deviation: 28
SwimmingPrognoseabstand: +39 s
Time: 9:55
Pace: 1:19 / 100 m
Ergebnisabstand: +25 s
Fehler: 13.8 s
H2H: 5 Gegner:innen,
5 Duelle,
Korrektur 0.23 %,
Sicherheit 30 %
CyclingPrediction: Group 2 (38 people)
Gruppe 1: 31 %
Speed: 43.3 km/h
Initial Gruppe 3, später eingeholt/vereinigt
Gap ahead:
0.2 s
Gap behind:
0.6 s
Result: Group 1 (18 people)
Speed: 43.7 km/h
Tempo-Fehler: -0.34 km/h
Running and totalRun: 19:56 (3:59 / km)
Historical basis: 3:59 / km
Best comparable pace: 3:59 / km
Trend: +0:00 / km
Comparable races: 1
H2H: 5 Gegner:innen,
5 Duelle,
Korrektur 0.00 %,
Sicherheit 30 %
Ergebnis Lauf: 15:44 (3:09 / km)
Error: +4:12 / +0:50 / km
Overall prediction: 50:47
Data basis: 1 Races · Confidence 0.20
Swimming:
9:55
(1:19 / 100 m)
To the end of cycling (group time):
29:49
(43.3 km/h)
Run:
19:56
(3:59 / km)
Total:
50:47
Target first bike group at the bike finishGoal: finish the bike split with the first bike group.
Estimated requirement:
Swim time: 9:29
Pace: 1:16 / 100 m
About 26.3 s faster in the swim
Maximum predicted gap after the swim: +12.5 s
The complete bike-group simulation, including catches and group mergers, is recalculated through the end of the bike split.
|
| 35 / 21 |
Eduardo Staniaski Gonçalves
BRA
|
+51 s
+71 s
|
G2 / G2
correct
|
20:20
15:56
|
51:11 | Show detailsPlacementPrediction: 35
80% range: 42–49
Top-10 probability: 0 %
Result: 21
Deviation: 14
SwimmingPrognoseabstand: +51 s
Time: 10:07
Pace: 1:21 / 100 m
Ergebnisabstand: +71 s
Fehler: -20.1 s
H2H: 10 Gegner:innen,
14 Duelle,
Korrektur -0.02 %,
Sicherheit 27 %
CyclingPrediction: Group 2 (38 people)
Gruppe 1: 25 %
Speed: 43.3 km/h
Initial Gruppe 4, später eingeholt/vereinigt
Gap ahead:
0.6 s
Gap behind:
1.6 s
Result: Group 2 (29 people)
Speed: 42.3 km/h
Tempo-Fehler: 1.04 km/h
Running and totalRun: 20:20 (4:04 / km)
Historical basis: 4:10 / km
Best comparable pace: 4:10 / km
Trend: +0:00 / km
Comparable races: 1
Fallback calculation from other run distances
H2H: 6 Gegner:innen,
7 Duelle,
Korrektur -2.47 %,
Sicherheit 22 %
Ergebnis Lauf: 15:56 (3:11 / km)
Error: +4:24 / +0:53 / km
Overall prediction: 51:11
Data basis: 5 Races · Confidence 1.00
Swimming:
10:07
(1:21 / 100 m)
To the end of cycling (group time):
29:49
(43.3 km/h)
Run:
20:20
(4:04 / km)
Total:
51:11
Target first bike group at the bike finishGoal: finish the bike split with the first bike group.
Estimated requirement:
Swim time: 9:29
Pace: 1:16 / 100 m
About 38.4 s faster in the swim
Maximum predicted gap after the swim: +12.5 s
The complete bike-group simulation, including catches and group mergers, is recalculated through the end of the bike split.
|
| 36 / 42 |
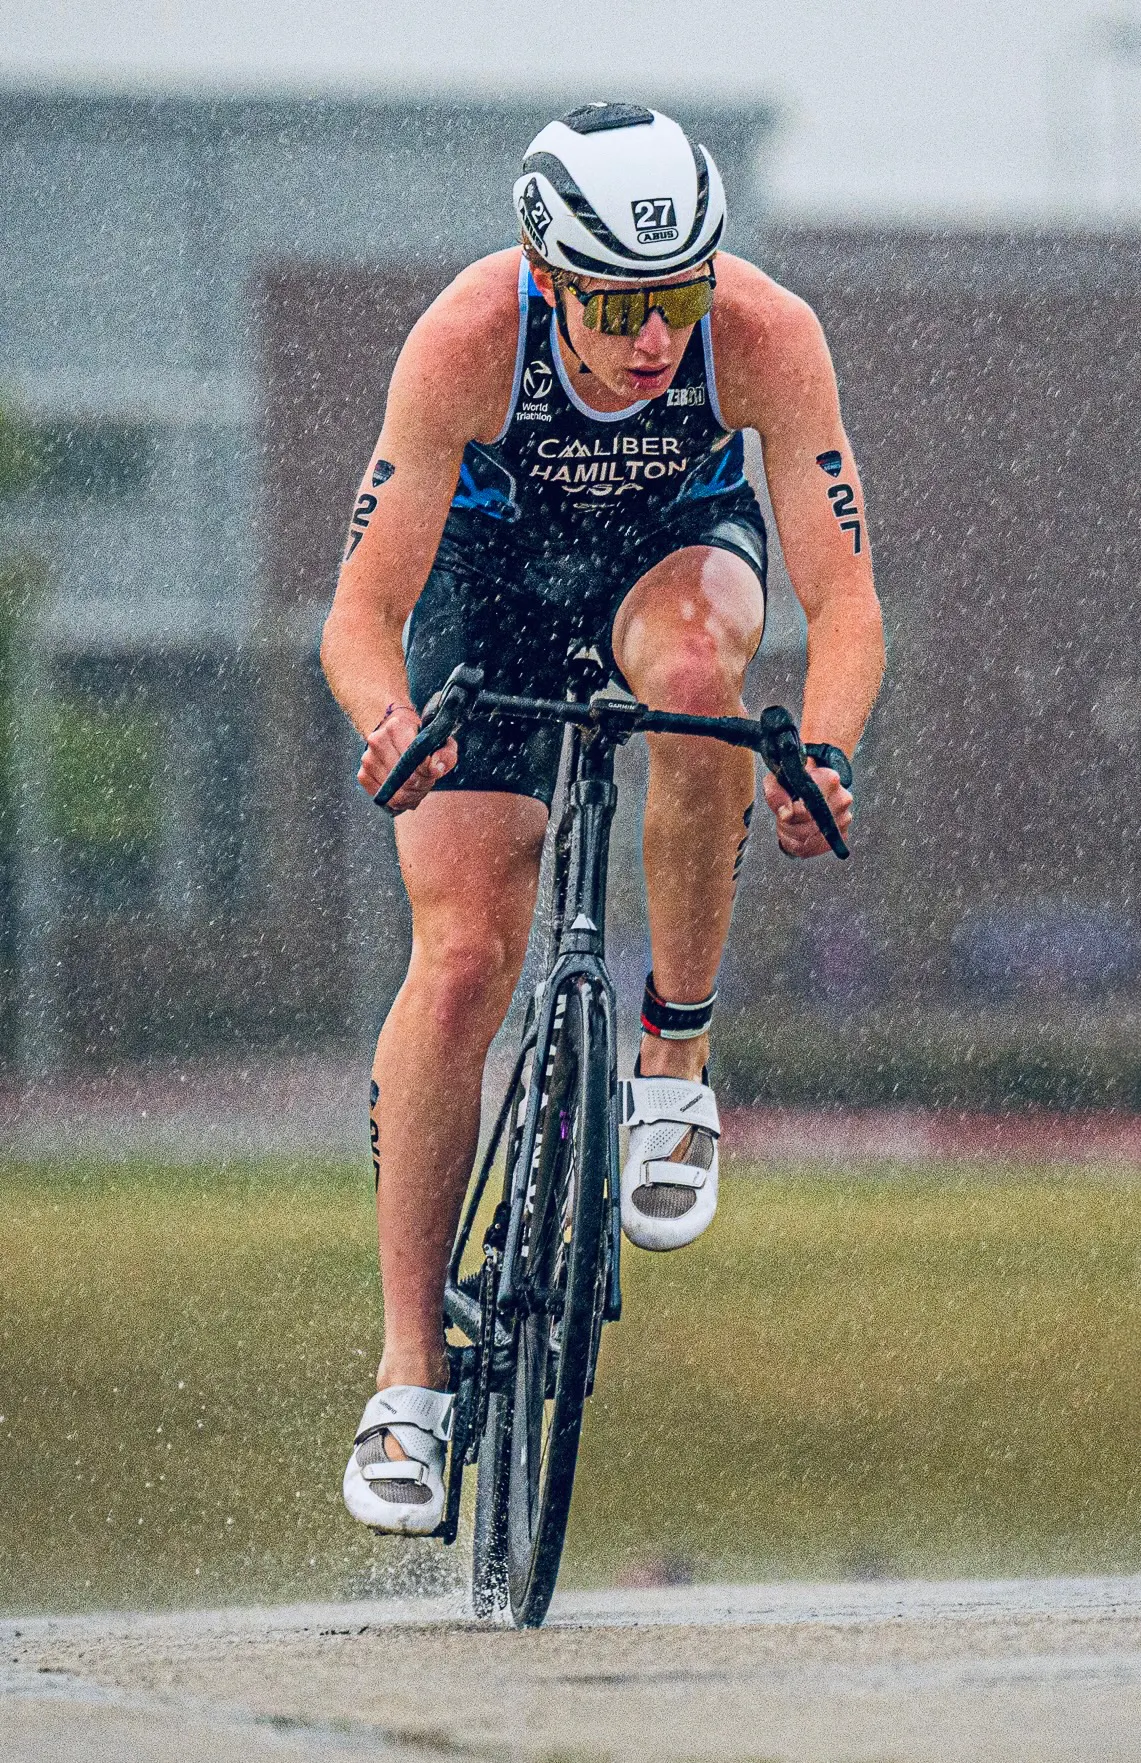 Elliot Hamilton
USA
|
+43 s
+72 s
|
G2 / G2
correct
|
20:24
18:30
|
51:15 | Show detailsPlacementPrediction: 36
80% range: 41–46
Top-10 probability: 0 %
Result: 42
Deviation: -6
SwimmingPrognoseabstand: +43 s
Time: 9:59
Pace: 1:20 / 100 m
Ergebnisabstand: +72 s
Fehler: -29.0 s
H2H: 7 Gegner:innen,
12 Duelle,
Korrektur 0.32 %,
Sicherheit 46 %
CyclingPrediction: Group 2 (38 people)
Gruppe 1: 33 %
Speed: 43.3 km/h
Initial Gruppe 4, später eingeholt/vereinigt
Gap ahead:
1.0 s
Gap behind:
0.8 s
Result: Group 2 (29 people)
Speed: 42.5 km/h
Tempo-Fehler: 0.86 km/h
Running and totalRun: 20:24 (4:05 / km)
Historical basis: 4:05 / km
Best comparable pace: 3:48 / km
Trend: +0:00 / km
Comparable races: 2
H2H: 7 Gegner:innen,
12 Duelle,
Korrektur -0.07 %,
Sicherheit 37 %
Ergebnis Lauf: 18:30 (3:42 / km)
Error: +1:54 / +0:23 / km
Overall prediction: 51:15
Data basis: 3 Races · Confidence 0.60
Swimming:
9:59
(1:20 / 100 m)
To the end of cycling (group time):
29:49
(43.3 km/h)
Run:
20:24
(4:05 / km)
Total:
51:15
Target first bike group at the bike finishGoal: finish the bike split with the first bike group.
Estimated requirement:
Swim time: 9:29
Pace: 1:16 / 100 m
About 30.1 s faster in the swim
Maximum predicted gap after the swim: +12.9 s
The complete bike-group simulation, including catches and group mergers, is recalculated through the end of the bike split.
|
| 37 / 28 |
Ignacio Ernesto Braga Giménez
ARG
|
+84 s
+29 s
|
G3 / G2
|
18:13
16:37
|
52:25 | Show detailsPlacementPrediction: 37
80% range: 36–48
Top-10 probability: 0 %
Result: 28
Deviation: 9
SwimmingPrognoseabstand: +84 s
Time: 10:40
Pace: 1:25 / 100 m
Ergebnisabstand: +29 s
Fehler: 54.8 s
H2H: 10 Gegner:innen,
13 Duelle,
Korrektur -1.56 %,
Sicherheit 48 %
CyclingPrediction: Group 3 (5 people)
Gruppe 1: 3 %
Speed: 40.0 km/h
Initial Gruppe 6, später eingeholt/vereinigt
Gap ahead:
12.8 s
Gap behind:
20.4 s
Result: Group 2 (29 people)
Speed: 41.6 km/h
Tempo-Fehler: -1.65 km/h
Running and totalRun: 18:13 (3:39 / km)
Historical basis: 3:41 / km
Best comparable pace: 3:23 / km
Trend: +0:00 / km
Comparable races: 3
H2H: 8 Gegner:innen,
11 Duelle,
Korrektur -1.08 %,
Sicherheit 37 %
Ergebnis Lauf: 16:37 (3:19 / km)
Error: +1:36 / +0:19 / km
Overall prediction: 52:25
Data basis: 7 Races · Confidence 1.00
Swimming:
10:40
(1:25 / 100 m)
To the end of cycling (group time):
32:28
(40.0 km/h)
Run:
18:13
(3:39 / km)
Total:
52:25
Target first bike group at the bike finishGoal: finish the bike split with the first bike group.
Estimated requirement:
Swim time: 9:29
Pace: 1:16 / 100 m
About 71.3 s faster in the swim
Maximum predicted gap after the swim: +12.5 s
The complete bike-group simulation, including catches and group mergers, is recalculated through the end of the bike split.
|
| 38 / 49 |
Angel Julian Vilema Cobos
ECU
|
+69 s
+66 s
|
G3 / G3
correct
|
18:37
18:05
|
52:49 | Show detailsPlacementPrediction: 38
80% range: 38–48
Top-10 probability: 0 %
Result: 49
Deviation: -11
SwimmingPrognoseabstand: +69 s
Time: 10:25
Pace: 1:23 / 100 m
Ergebnisabstand: +66 s
Fehler: 3.0 s
H2H: 21 Gegner:innen,
26 Duelle,
Korrektur 1.30 %,
Sicherheit 69 %
CyclingPrediction: Group 3 (5 people)
Gruppe 1: 0 %
Speed: 40.0 km/h
Initial Gruppe 5, später eingeholt/vereinigt
Gap ahead:
2.5 s
Gap behind:
2.0 s
Result: Group 3 (5 people)
Speed: 39.2 km/h
Tempo-Fehler: 0.78 km/h
Running and totalRun: 18:37 (3:43 / km)
Historical basis: 3:42 / km
Best comparable pace: 3:42 / km
Trend: +0:00 / km
Comparable races: 2
H2H: 16 Gegner:innen,
19 Duelle,
Korrektur 0.42 %,
Sicherheit 61 %
Ergebnis Lauf: 18:05 (3:37 / km)
Error: +0:32 / +0:06 / km
Overall prediction: 52:49
Data basis: 4 Races · Confidence 0.80
Swimming:
10:25
(1:23 / 100 m)
To the end of cycling (group time):
32:28
(40.0 km/h)
Run:
18:37
(3:43 / km)
Total:
52:49
Target first bike group at the bike finishGoal: finish the bike split with the first bike group.
Estimated requirement:
Swim time: 9:29
Pace: 1:16 / 100 m
About 56.5 s faster in the swim
Maximum predicted gap after the swim: +12.5 s
The complete bike-group simulation, including catches and group mergers, is recalculated through the end of the bike split.
|
| 39 / 51 |
Leandro Alfonso Martinez
URU
|
+71 s
+78 s
|
G3 / G3
correct
|
20:28
19:19
|
54:40 | Show detailsPlacementPrediction: 39
80% range: 47–49
Top-10 probability: 0 %
Result: 51
Deviation: -12
SwimmingPrognoseabstand: +71 s
Time: 10:27
Pace: 1:24 / 100 m
Ergebnisabstand: +78 s
Fehler: -7.0 s
H2H: 5 Gegner:innen,
5 Duelle,
Korrektur -0.24 %,
Sicherheit 24 %
CyclingPrediction: Group 3 (5 people)
Gruppe 1: 0 %
Speed: 40.0 km/h
Initial Gruppe 5, später eingeholt/vereinigt
Gap ahead:
2.0 s
Gap behind:
12.8 s
Result: Group 3 (5 people)
Speed: 39.4 km/h
Tempo-Fehler: 0.58 km/h
Running and totalRun: 20:28 (4:06 / km)
Historical basis: 4:10 / km
Best comparable pace: 4:10 / km
Trend: +0:00 / km
Comparable races: 1
H2H: 4 Gegner:innen,
4 Duelle,
Korrektur -1.86 %,
Sicherheit 19 %
Ergebnis Lauf: 19:19 (3:52 / km)
Error: +1:09 / +0:14 / km
Overall prediction: 54:40
Data basis: 6 Races · Confidence 1.00
Swimming:
10:27
(1:24 / 100 m)
To the end of cycling (group time):
32:28
(40.0 km/h)
Run:
20:28
(4:06 / km)
Total:
54:40
Target first bike group at the bike finishGoal: finish the bike split with the first bike group.
Estimated requirement:
Swim time: 9:29
Pace: 1:16 / 100 m
About 58.5 s faster in the swim
Maximum predicted gap after the swim: +12.5 s
The complete bike-group simulation, including catches and group mergers, is recalculated through the end of the bike split.
|
| 40 / 39 |
Juan Marcos Aristizabal Ortiz
CHI
|
+214 s
+54 s
|
G5 / G2
|
17:30
17:38
|
1:01:54 | Show detailsPlacementPrediction: 40
80% range: 50–50
Top-10 probability: 0 %
Result: 39
Deviation: 1
SwimmingPrognoseabstand: +214 s
Time: 12:50
Pace: 1:43 / 100 m
Ergebnisabstand: +54 s
Fehler: 160.4 s
H2H: 8 Gegner:innen,
8 Duelle,
Korrektur -0.62 %,
Sicherheit 8 %
CyclingPrediction: Group 5 (2 people)
Gruppe 1: 0 %
Speed: 31.7 km/h
Initial Gruppe 11, später eingeholt/vereinigt
Gap ahead:
4.4 s
Gap behind:
–
Result: Group 2 (29 people)
Speed: 42.0 km/h
Tempo-Fehler: -10.26 km/h
Running and totalRun: 17:30 (3:30 / km)
Historical basis: 3:29 / km
Best comparable pace: 3:29 / km
Trend: +0:00 / km
Comparable races: 1
H2H: 1 Gegner:innen,
1 Duelle,
Korrektur 0.70 %,
Sicherheit 1 %
Ergebnis Lauf: 17:38 (3:32 / km)
Error: −0:08 / −0:02 / km
Overall prediction: 1:01:54
Data basis: 3 Races · Confidence 0.60
Swimming:
12:50
(1:43 / 100 m)
To the end of cycling (group time):
40:49
(31.7 km/h)
Run:
17:30
(3:30 / km)
Total:
1:01:54
Target first bike group at the bike finishGoal: finish the bike split with the first bike group.
Estimated requirement:
Swim time: 9:28
Pace: 1:16 / 100 m
About 201.9 s faster in the swim
Maximum predicted gap after the swim: +12.5 s
The complete bike-group simulation, including catches and group mergers, is recalculated through the end of the bike split.
|
| 0 / 10 |
Emiliano Magno Vargas Carrasco
MEX
|
+0 s
+26 s
|
G0 / G1
|
16:06
|
Show detailsPlacementPrediction: 0
80% range: 51–51
Top-10 probability: 0 %
Result: 10
Deviation:
SwimmingPrognoseabstand: +0 s
Time: 9:16
Pace: 1:14 / 100 m
Ergebnisabstand: +26 s
Fehler: 0.0 s
CyclingPrediction: Group 0 (0 people)
Gruppe 1: 0 %
Speed: 0.0 km/h
Gap ahead:
–
Gap behind:
–
Result: Group 1 (18 people)
Speed: 44.0 km/h
Tempo-Fehler: 0.00 km/h
Running and totalRun: ()
Historical basis:
Best comparable pace:
Trend: +0:00 / km
Comparable races: 0
Fallback calculation from other run distances
Ergebnis Lauf: 16:06 (3:13 / km)
Error: /
Overall prediction:
Data basis: 0 Races · Confidence 0.00
Swimming:
9:16
(1:14 / 100 m)
To the end of cycling (group time):
–
Run:
–
Total:
not fully calculable
Target first bike group at the bike finish
Cannot be calculated without a swim distance or historical swim data.
|
|
| 0 / 13 |
Henrique Domingues
BRA
|
+150 s
+26 s
|
G4 / G1
|
16:40
|
Show detailsPlacementPrediction: 0
80% range: 7–9
Top-10 probability: 100 %
Result: 13
Deviation: -13
SwimmingPrognoseabstand: +150 s
Time: 11:46
Pace: 1:34 / 100 m
Ergebnisabstand: +26 s
Fehler: 124.0 s
H2H: 1 Gegner:innen,
1 Duelle,
Korrektur -2.47 %,
Sicherheit 5 %
CyclingPrediction: Group 4 (3 people)
Gruppe 1: 0 %
Speed: 37.7 km/h
Initial Gruppe 9, später eingeholt/vereinigt
Gap ahead:
25.7 s
Gap behind:
34.0 s
Result: Group 1 (18 people)
Speed: 43.9 km/h
Tempo-Fehler: -6.28 km/h
Running and totalRun: ()
Historical basis:
Best comparable pace:
Trend: +0:00 / km
Comparable races: 0
Fallback calculation from other run distances
Ergebnis Lauf: 16:40 (3:20 / km)
Error: /
Overall prediction:
Data basis: 2 Races · Confidence 0.40
Swimming:
11:46
(1:34 / 100 m)
To the end of cycling (group time):
33:54
(37.7 km/h)
Run:
–
Total:
not fully calculable
Target first bike group at the bike finishGoal: finish the bike split with the first bike group.
Estimated requirement:
Swim time: 9:33
Pace: 1:16 / 100 m
About 133.5 s faster in the swim
Maximum predicted gap after the swim: +16.5 s
The complete bike-group simulation, including catches and group mergers, is recalculated through the end of the bike split.
|
|
| 0 / 31 |
Garrett Gehringer
USA
|
+18 s
+45 s
|
G2 / G2
correct
|
16:49
|
Show detailsPlacementPrediction: 0
80% range: 1–5
Top-10 probability: 100 %
Result: 31
Deviation: -31
SwimmingPrognoseabstand: +18 s
Time: 9:34
Pace: 1:17 / 100 m
Ergebnisabstand: +45 s
Fehler: -27.0 s
CyclingPrediction: Group 2 (38 people)
Gruppe 1: 60 %
Speed: 43.3 km/h
Initial Gruppe 3, später eingeholt/vereinigt
Gap ahead:
10.4 s
Gap behind:
2.1 s
Result: Group 2 (29 people)
Speed: 41.7 km/h
Tempo-Fehler: 1.61 km/h
Running and totalRun: ()
Historical basis:
Best comparable pace:
Trend: +0:00 / km
Comparable races: 0
Fallback calculation from other run distances
Ergebnis Lauf: 16:49 (3:22 / km)
Error: /
Overall prediction:
Data basis: 1 Races · Confidence 0.20
Swimming:
9:34
(1:17 / 100 m)
To the end of cycling (group time):
29:49
(43.3 km/h)
Run:
–
Total:
not fully calculable
Target first bike group at the bike finishGoal: finish the bike split with the first bike group.
Estimated requirement:
Swim time: 9:29
Pace: 1:16 / 100 m
About 5.5 s faster in the swim
Maximum predicted gap after the swim: +12.5 s
The complete bike-group simulation, including catches and group mergers, is recalculated through the end of the bike split.
|
|
| 0 / 32 |
Matthew Leatherbee
CHI
|
+210 s
+78 s
|
G5 / G2
|
17:20
|
Show detailsPlacementPrediction: 0
80% range: 7–10
Top-10 probability: 95 %
Result: 32
Deviation: -32
SwimmingPrognoseabstand: +210 s
Time: 12:46
Pace: 1:42 / 100 m
Ergebnisabstand: +78 s
Fehler: 132.0 s
CyclingPrediction: Group 5 (2 people)
Gruppe 1: 0 %
Speed: 31.7 km/h
Initial Gruppe 11, später eingeholt/vereinigt
Gap ahead:
26.0 s
Gap behind:
4.4 s
Result: Group 2 (29 people)
Speed: 42.5 km/h
Tempo-Fehler: -10.75 km/h
Running and totalRun: ()
Historical basis:
Best comparable pace:
Trend: +0:00 / km
Comparable races: 0
Fallback calculation from other run distances
Ergebnis Lauf: 17:20 (3:28 / km)
Error: /
Overall prediction:
Data basis: 1 Races · Confidence 0.20
Swimming:
12:46
(1:42 / 100 m)
To the end of cycling (group time):
40:49
(31.7 km/h)
Run:
–
Total:
not fully calculable
Target first bike group at the bike finishGoal: finish the bike split with the first bike group.
Estimated requirement:
Swim time: 9:29
Pace: 1:16 / 100 m
About 197.5 s faster in the swim
Maximum predicted gap after the swim: +12.5 s
The complete bike-group simulation, including catches and group mergers, is recalculated through the end of the bike split.
|
|
| 0 / 33 |
Joaquín Valverde
ARG
|
+53 s
+73 s
|
G2 / G2
correct
|
17:32
|
Show detailsPlacementPrediction: 0
80% range: 2–7
Top-10 probability: 100 %
Result: 33
Deviation: -33
SwimmingPrognoseabstand: +53 s
Time: 10:09
Pace: 1:21 / 100 m
Ergebnisabstand: +73 s
Fehler: -19.7 s
H2H: 10 Gegner:innen,
12 Duelle,
Korrektur 2.13 %,
Sicherheit 32 %
CyclingPrediction: Group 2 (38 people)
Gruppe 1: 19 %
Speed: 43.3 km/h
Initial Gruppe 4, später eingeholt/vereinigt
Gap ahead:
0.8 s
Gap behind:
0.3 s
Result: Group 2 (29 people)
Speed: 42.4 km/h
Tempo-Fehler: 0.95 km/h
Running and totalRun: ()
Historical basis:
Best comparable pace:
Trend: +0:00 / km
Comparable races: 0
Fallback calculation from other run distances
Ergebnis Lauf: 17:32 (3:30 / km)
Error: /
Overall prediction:
Data basis: 6 Races · Confidence 1.00
Swimming:
10:09
(1:21 / 100 m)
To the end of cycling (group time):
29:49
(43.3 km/h)
Run:
–
Total:
not fully calculable
Target first bike group at the bike finishGoal: finish the bike split with the first bike group.
Estimated requirement:
Swim time: 9:28
Pace: 1:16 / 100 m
About 40.8 s faster in the swim
Maximum predicted gap after the swim: +12.5 s
The complete bike-group simulation, including catches and group mergers, is recalculated through the end of the bike split.
|
|
| 0 / 34 |
Gael Gonzalez Vasquez
CHI
|
+184 s
+55 s
|
G4 / G2
|
17:32
|
Show detailsPlacementPrediction: 0
80% range: 7–10
Top-10 probability: 100 %
Result: 34
Deviation: -34
SwimmingPrognoseabstand: +184 s
Time: 12:20
Pace: 1:39 / 100 m
Ergebnisabstand: +55 s
Fehler: 129.0 s
CyclingPrediction: Group 4 (3 people)
Gruppe 1: 0 %
Speed: 37.7 km/h
Initial Gruppe 10, später eingeholt/vereinigt
Gap ahead:
34.0 s
Gap behind:
26.0 s
Result: Group 2 (29 people)
Speed: 42.1 km/h
Tempo-Fehler: -4.42 km/h
Running and totalRun: ()
Historical basis:
Best comparable pace:
Trend: +0:00 / km
Comparable races: 0
Fallback calculation from other run distances
Ergebnis Lauf: 17:32 (3:30 / km)
Error: /
Overall prediction:
Data basis: 1 Races · Confidence 0.20
Swimming:
12:20
(1:39 / 100 m)
To the end of cycling (group time):
33:54
(37.7 km/h)
Run:
–
Total:
not fully calculable
Target first bike group at the bike finishGoal: finish the bike split with the first bike group.
Estimated requirement:
Swim time: 9:29
Pace: 1:16 / 100 m
About 171.5 s faster in the swim
Maximum predicted gap after the swim: +12.5 s
The complete bike-group simulation, including catches and group mergers, is recalculated through the end of the bike split.
|
|
| 0 / 37 |
Sebastian Damian
CAN
|
+0 s
+31 s
|
G0 / G2
|
17:41
|
Show detailsPlacementPrediction: 0
80% range: 52–52
Top-10 probability: 0 %
Result: 37
Deviation:
SwimmingPrognoseabstand: +0 s
Time: 9:16
Pace: 1:14 / 100 m
Ergebnisabstand: +31 s
Fehler: 0.0 s
CyclingPrediction: Group 0 (0 people)
Gruppe 1: 0 %
Speed: 0.0 km/h
Gap ahead:
–
Gap behind:
–
Result: Group 2 (29 people)
Speed: 41.5 km/h
Tempo-Fehler: 0.00 km/h
Running and totalRun: ()
Historical basis:
Best comparable pace:
Trend: +0:00 / km
Comparable races: 0
Fallback calculation from other run distances
Ergebnis Lauf: 17:41 (3:32 / km)
Error: /
Overall prediction:
Data basis: 0 Races · Confidence 0.00
Swimming:
9:16
(1:14 / 100 m)
To the end of cycling (group time):
–
Run:
–
Total:
not fully calculable
Target first bike group at the bike finish
Cannot be calculated without a swim distance or historical swim data.
|
|
| 0 / 40 |
Jérôme Côté
CAN
|
+34 s
+35 s
|
G2 / G2
correct
|
17:54
|
Show detailsPlacementPrediction: 0
80% range: 2–5
Top-10 probability: 100 %
Result: 40
Deviation: -40
SwimmingPrognoseabstand: +34 s
Time: 9:50
Pace: 1:19 / 100 m
Ergebnisabstand: +35 s
Fehler: -1.1 s
CyclingPrediction: Group 2 (38 people)
Gruppe 1: 36 %
Speed: 43.3 km/h
Initial Gruppe 3, später eingeholt/vereinigt
Gap ahead:
0.8 s
Gap behind:
0.6 s
Result: Group 2 (29 people)
Speed: 41.5 km/h
Tempo-Fehler: 1.83 km/h
Running and totalRun: ()
Historical basis:
Best comparable pace:
Trend: +0:00 / km
Comparable races: 0
Fallback calculation from other run distances
Ergebnis Lauf: 17:54 (3:35 / km)
Error: /
Overall prediction:
Data basis: 1 Races · Confidence 0.20
Swimming:
9:50
(1:19 / 100 m)
To the end of cycling (group time):
29:49
(43.3 km/h)
Run:
–
Total:
not fully calculable
Target first bike group at the bike finishGoal: finish the bike split with the first bike group.
Estimated requirement:
Swim time: 9:29
Pace: 1:16 / 100 m
About 21.4 s faster in the swim
Maximum predicted gap after the swim: +12.5 s
The complete bike-group simulation, including catches and group mergers, is recalculated through the end of the bike split.
|
|
| 0 / 44 |
Ángel David Ernesto Aguilar Bolaños
GUA
|
+42 s
+47 s
|
G2 / G2
correct
|
18:32
|
Show detailsPlacementPrediction: 0
80% range: 2–6
Top-10 probability: 100 %
Result: 44
Deviation: -44
SwimmingPrognoseabstand: +42 s
Time: 9:58
Pace: 1:20 / 100 m
Ergebnisabstand: +47 s
Fehler: -5.5 s
H2H: 5 Gegner:innen,
6 Duelle,
Korrektur 0.30 %,
Sicherheit 22 %
CyclingPrediction: Group 2 (38 people)
Gruppe 1: 33 %
Speed: 43.3 km/h
Initial Gruppe 4, später eingeholt/vereinigt
Gap ahead:
0.6 s
Gap behind:
0.5 s
Result: Group 2 (29 people)
Speed: 42.0 km/h
Tempo-Fehler: 1.34 km/h
Running and totalRun: ()
Historical basis:
Best comparable pace:
Trend: +0:00 / km
Comparable races: 0
Fallback calculation from other run distances
Ergebnis Lauf: 18:32 (3:42 / km)
Error: /
Overall prediction:
Data basis: 6 Races · Confidence 1.00
Swimming:
9:58
(1:20 / 100 m)
To the end of cycling (group time):
29:49
(43.3 km/h)
Run:
–
Total:
not fully calculable
Target first bike group at the bike finishGoal: finish the bike split with the first bike group.
Estimated requirement:
Swim time: 9:29
Pace: 1:16 / 100 m
About 29 s faster in the swim
Maximum predicted gap after the swim: +12.5 s
The complete bike-group simulation, including catches and group mergers, is recalculated through the end of the bike split.
|
|
| 0 / 45 |
Florian Muñoz
ARG
|
+124 s
+31 s
|
G4 / G2
|
18:59
|
Show detailsPlacementPrediction: 0
80% range: 7–10
Top-10 probability: 100 %
Result: 45
Deviation: -45
SwimmingPrognoseabstand: +124 s
Time: 11:20
Pace: 1:31 / 100 m
Ergebnisabstand: +31 s
Fehler: 93.3 s
H2H: 4 Gegner:innen,
5 Duelle,
Korrektur -2.47 %,
Sicherheit 26 %
CyclingPrediction: Group 4 (3 people)
Gruppe 1: 1 %
Speed: 37.7 km/h
Initial Gruppe 8, später eingeholt/vereinigt
Gap ahead:
20.1 s
Gap behind:
25.7 s
Result: Group 2 (29 people)
Speed: 41.5 km/h
Tempo-Fehler: -3.88 km/h
Running and totalRun: ()
Historical basis:
Best comparable pace:
Trend: +0:00 / km
Comparable races: 0
Fallback calculation from other run distances
Ergebnis Lauf: 18:59 (3:48 / km)
Error: /
Overall prediction:
Data basis: 5 Races · Confidence 1.00
Swimming:
11:20
(1:31 / 100 m)
To the end of cycling (group time):
33:54
(37.7 km/h)
Run:
–
Total:
not fully calculable
Target first bike group at the bike finishGoal: finish the bike split with the first bike group.
Estimated requirement:
Swim time: 9:28
Pace: 1:16 / 100 m
About 111.8 s faster in the swim
Maximum predicted gap after the swim: +12.5 s
The complete bike-group simulation, including catches and group mergers, is recalculated through the end of the bike split.
|
|
| 0 / 46 |
Santiago Fernandez
PUR
|
+26 s
+33 s
|
G2 / G2
correct
|
19:08
|
Show detailsPlacementPrediction: 0
80% range: 2–5
Top-10 probability: 100 %
Result: 46
Deviation: -46
SwimmingPrognoseabstand: +26 s
Time: 9:42
Pace: 1:18 / 100 m
Ergebnisabstand: +33 s
Fehler: -7.3 s
H2H: 9 Gegner:innen,
13 Duelle,
Korrektur 0.34 %,
Sicherheit 54 %
CyclingPrediction: Group 2 (38 people)
Gruppe 1: 48 %
Speed: 43.3 km/h
Initial Gruppe 3, später eingeholt/vereinigt
Gap ahead:
0.2 s
Gap behind:
3.1 s
Result: Group 2 (29 people)
Speed: 41.6 km/h
Tempo-Fehler: 1.76 km/h
Running and totalRun: ()
Historical basis:
Best comparable pace:
Trend: +0:00 / km
Comparable races: 0
Fallback calculation from other run distances
Ergebnis Lauf: 19:08 (3:50 / km)
Error: /
Overall prediction:
Data basis: 7 Races · Confidence 1.00
Swimming:
9:42
(1:18 / 100 m)
To the end of cycling (group time):
29:49
(43.3 km/h)
Run:
–
Total:
not fully calculable
Target first bike group at the bike finishGoal: finish the bike split with the first bike group.
Estimated requirement:
Swim time: 9:29
Pace: 1:16 / 100 m
About 13.2 s faster in the swim
Maximum predicted gap after the swim: +12.5 s
The complete bike-group simulation, including catches and group mergers, is recalculated through the end of the bike split.
|
|
| 0 / 52 |
Jonathan Calderón
ECU
|
+0 s
+69 s
|
G1 / G4
|
18:54
|
Show detailsPlacementPrediction: 0
80% range: 1–5
Top-10 probability: 100 %
Result: 52
Deviation: -52
SwimmingPrognoseabstand: +0 s
Time: 9:16
Pace: 1:14 / 100 m
Ergebnisabstand: +69 s
Fehler: -69.0 s
CyclingPrediction: Group 1 (2 people)
Gruppe 1: 96 %
Speed: 42.4 km/h
Initial Gruppe 1, später eingeholt/vereinigt
Gap ahead:
–
Gap behind:
7.6 s
Result: Group 4 (1 people)
Speed: 38.1 km/h
Tempo-Fehler: 4.28 km/h
Running and totalRun: ()
Historical basis:
Best comparable pace:
Trend: +0:00 / km
Comparable races: 0
Fallback calculation from other run distances
Ergebnis Lauf: 18:54 (3:47 / km)
Error: /
Overall prediction:
Data basis: 2 Races · Confidence 0.40
Swimming:
9:16
(1:14 / 100 m)
To the end of cycling (group time):
30:36
(42.4 km/h)
Run:
–
Total:
not fully calculable
|
|
| 0 / 53 |
Fabricio Samuel Mamani Gomez
BOL
|
+0 s
+49 s
|
G0 / G5
|
18:26
|
Show detailsPlacementPrediction: 0
80% range: 53–53
Top-10 probability: 0 %
Result: 53
Deviation:
SwimmingPrognoseabstand: +0 s
Time: 9:16
Pace: 1:14 / 100 m
Ergebnisabstand: +49 s
Fehler: 0.0 s
CyclingPrediction: Group 0 (0 people)
Gruppe 1: 0 %
Speed: 0.0 km/h
Gap ahead:
–
Gap behind:
–
Result: Group 5 (1 people)
Speed: 34.2 km/h
Tempo-Fehler: 0.00 km/h
Running and totalRun: ()
Historical basis:
Best comparable pace:
Trend: +0:00 / km
Comparable races: 0
Fallback calculation from other run distances
Ergebnis Lauf: 18:26 (3:41 / km)
Error: /
Overall prediction:
Data basis: 0 Races · Confidence 0.00
Swimming:
9:16
(1:14 / 100 m)
To the end of cycling (group time):
–
Run:
–
Total:
not fully calculable
Target first bike group at the bike finish
Cannot be calculated without a swim distance or historical swim data.
|